On Wednesday, July 31, the Federal Reserve cut the federal funds rate for the first time since 2008.
Today, we’ll examine the financial impact of rate hikes and rate cuts… And I’ll tell you the levels at which to add to your C position.
The Fed cited several factors for the cut, including slowing growth of business fixed investment… inflation (excluding food and energy) running below the Fed’s 2% target… and uncertain global economic growth.
The Fed funds rate was cut by 25 basis points to 2–2.25%. It was accompanied by the decision to stop “quantitative tightening” immediately, with the balance sheet still bloated at $3.8 trillion—down from $4.5 trillion at the end of September 2017.
Former Fed Chair Janet Yellen chimed in last week favoring this decision. You might recall she’s the one who began the rate-rising program in December 2015… and a series of nine rate hikes. (See box, below.)
A recent report by WalletHub explains the financial impact of rate hikes and rate cuts. Those nine rate hikes cost credit card users up to $14 billion more in financing charges just this year. Wednesday’s rate cut will reduce the interest rate charges by about $1.5 billion over the next 12 months.
Fed chairs of the 21st century have become too transparent, baffling market participants when they change their minds midstream… And Fed Chairman Jerome Powell’s first rate cut left Wall Street rather confused. It expected guidance toward lower rates.
Speaking out of both sides of his mouth, the Fed Chair described this cut as an economic “insurance” cut or a mid-cycle adjustment… while future rate decisions will be data-dependent. This left some to say the move was “one and done.”
One thing we know is President Trump wanted a 50-basis-point cut and an end to “quantitative tightening.” He received the latter, but said Fed Chair Powell “let us down” by not clearly signaling additional rate cuts.
The recent Beige Book published for the July 30–31 Federal Open Market Committee (FOMC) meeting suggested continued growth in the U.S. economy. Instead of following economic logic, and keeping rates steady, the Fed followed Wall Street—which wanted a rate cut to keep the stock market humming.
It seems to me this move by the Fed was already priced in…
The FOMC should have taken back its independence by leaving rates unchanged. It could have continued “quantitative tightening” until its pause date at the end of September.
Last week, the Federal Reserve drained $5 billion from the banking system… reducing the balance sheet down to $3.8 trillion. That’s down $697 billion since September 2017.
Fed Chair Powell has said he wanted the balance sheet to be $3.5 trillion… So at $3.8 trillion, he’s short of his stated goal—by $300 billion.
Citigroup (C) has been the best performer among the four “too-big-to-fail” money center banks. And the lower fed funds rate will help its clients with lower credit card interest payments, lower mortgage rates, and the ability to qualify for home equity loans.
Below I’ll tell you what the daily and weekly charts are showing for C today… and the levels at which to add to your position.
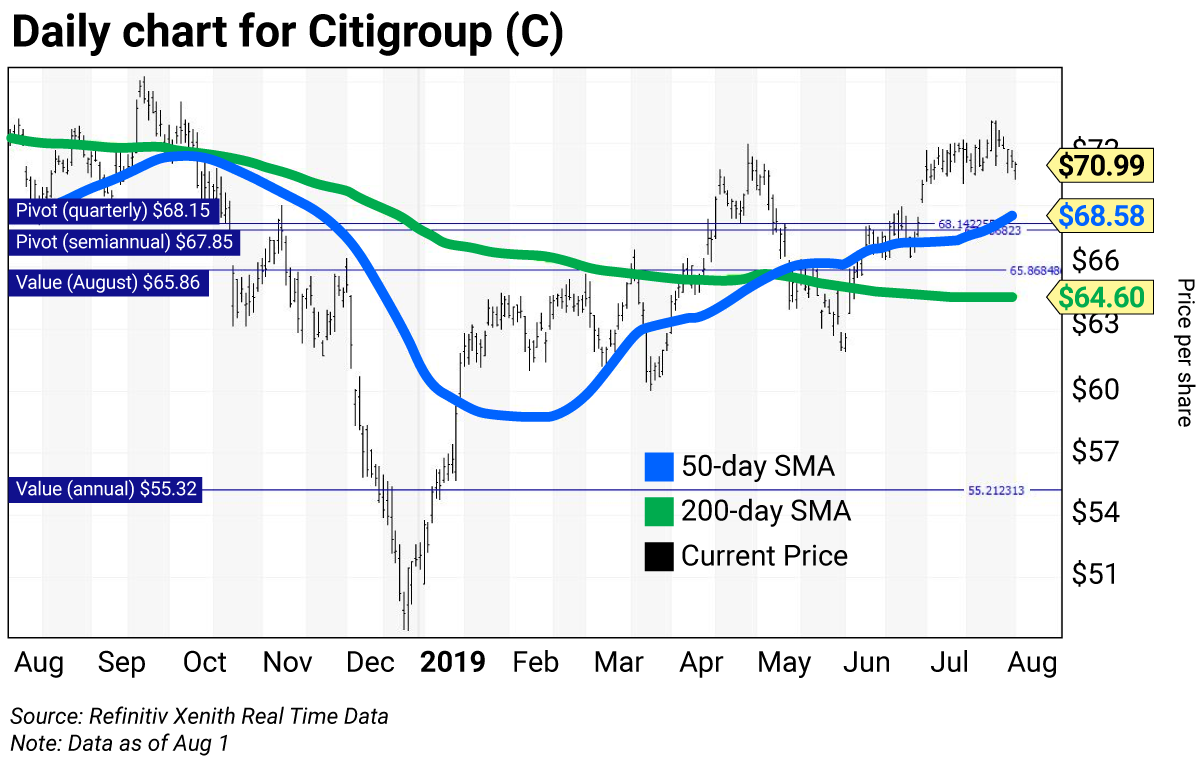
The daily chart for Citigroup shows the stock has been above a “golden cross” since May 7, when the 50-day simple moving average (SMA) rose above the 200-day SMA to indicate that higher prices lie ahead.
The stock could have been bought at its 200-day SMA between May 13 and June 5, when the average was $64.95.
The horizontal lines are Citigroup’s strategic trading levels:
- Pivot/value (quarterly) $68.15
- Pivot/value (semiannual) $67.85
- Value (August) $65.86
- Value (annual) $55.32
Value, pivot, and risky levels
Value, pivot, and risky levels pinpoint buy and sell levels and are a great tool for maximizing gains and limiting losses on stocks you plan to hold long-term.
Risky level: sits above where the stock is trading
Pivot level: often sits right around where the stock is trading. A pivot level is a value level or risky level that was violated within its time horizon. Pivots act as magnets that have a high probability of being tested again before the time horizon expires.
Value level: sits below where the stock is trading
The general idea is to buy around a value level line and reduce holdings around the risky level line. You can rebuild your position on weakness.
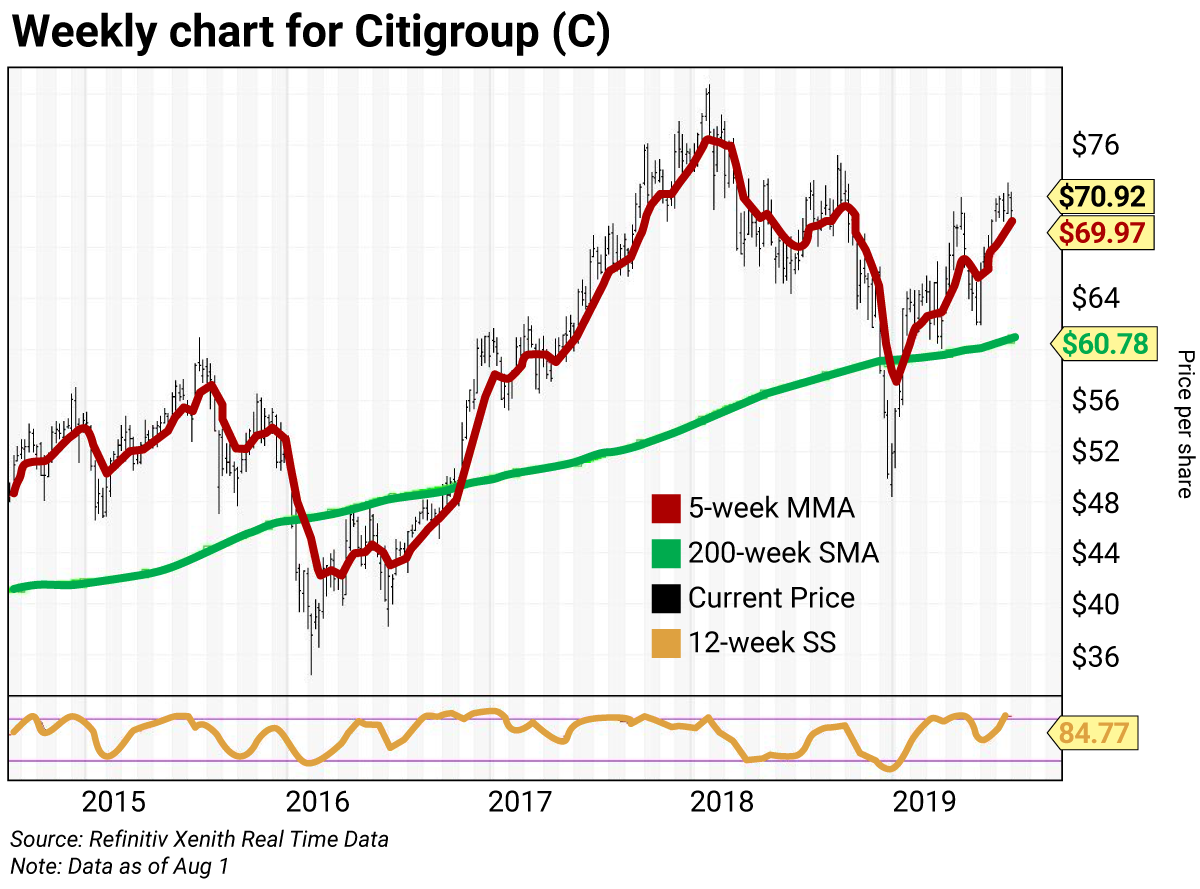
The weekly chart for Citigroup is positive but overbought, with the stock above its five-week modified moving average (MMA) of $70.00. The stock is well above its 200-week SMA or “reversion to the mean” at $60.78. Citigroup has been above its reversion to the mean since the week of January 16, when the average was $58.68.
The 12-week slow stochastic reading (gold line along the bottom) is projected to hit 84.89 this week, up from 83.82 on July 26. At the December low, this reading was 8.13. Any reading below 10 is too cheap to ignore.
Trading strategy:
Buy Citigroup (C) on weakness to the quarterly and semiannual pivot/value levels at $68.15 and $67.85, respectively. Add to positions on weakness to its monthly value level at $65.86.
A brief history of Federal Reserve rate changes
I began my career in the financial industry in 1972 as a U.S. Treasury trader in the primary dealer community. Back then, Fed policy decisions were made in secrecy… and change announcements occurred 90 days after they were made.
Between October 1979 and October 1982, Fed Chair Paul Volcker began setting policy targeting money supply… Rate changes were so significant I called his policy “shock and awe.” Once the oil-induced inflation began to normalize, policy shifted back to the federal funds rate.
In July 1993, under Fed Chair Alan Greenspan, the Federal Reserve’s monetary policy became more transparent.
At the end of 1999, the funds rate was 5.5% and rising. The Greenspan FOMC was hiking rates to offset the easing money policy in place due to Y2K concerns about possible dislocations in the banking system. This concern helped contribute to the tech bubble that began to pop in March 2000. By May 2000, the FOMC had raised the funds rate to 6.5% before changing direction.
After the 9/11 terrorist attacks, the funds rate was cut to 3% on September 17, 2001, then reached a low of 1% on June 25, 2003. These artificially low rates fueled the housing bubble. The bubble continued to inflate as the FOMC began a series of 17 consecutive 25-basis-point rate hikes beginning on June 20, 2004. The last of these hikes was to 5.25% on June 29, 2006, which was the peak month for home prices. The FOMC thus fueled—and subsequently popped—the housing bubble.
Ben Bernanke was Fed Chair during this string of rate hikes between 2006 and 2014. The baton was then passed to Janet Yellen.
The first Bernanke rate cut was to 4.75% on September 18, 2007. Subsequent rate cuts continued until being pushed to 0–0.25% by the Yellen Fed on December 16, 2008, where it overstayed its welcome until December 2015.
In the new millennium, Fed policy has helped inflate and burst several asset bubbles. In addition to the housing bubble, we’ve seen the oil bubble and the gold bubble. Today, the housing bubble has re-inflated… and stock averages look like inflating bubbles.

 | Rich Suttmeier Founder & CEO, Global Market Consultants |
Editor’s note: If you’ve got a portfolio of financial stocks, Rich says you should choose among four names—including Citigroup. If you missed the Q1 “scorecard” for each of these banks… and the levels to trade them… check out FDIC data favors these four bank stocks.


