
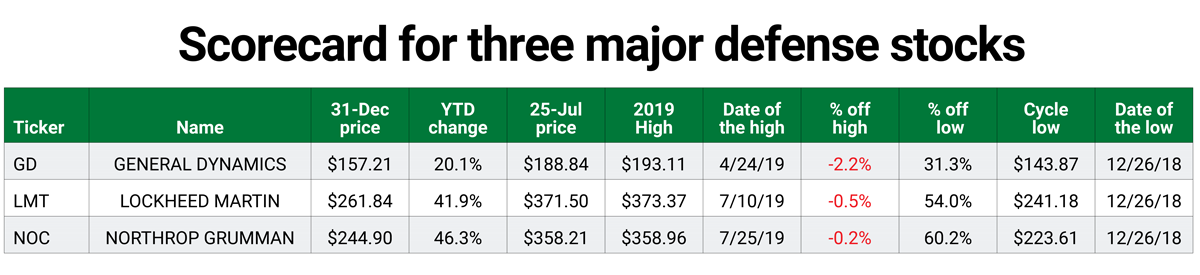
Defense spending is set to rise to $716 billion in fiscal year (FY) 2019… $738 billion in FY 2020… and $741 billion in FY 2021.
The best way to play this growth in military spending is to own General Dynamics Corp. (GD), Lockheed Martin Corp (LMT), and Northrop Grumman (NOC).
Below I’ll cover the daily charts for these three companies, summarize the fundamentals, and provide the trading strategy based on today’s levels.
For details on how to use the chart indicators and trading levels, see the box below.
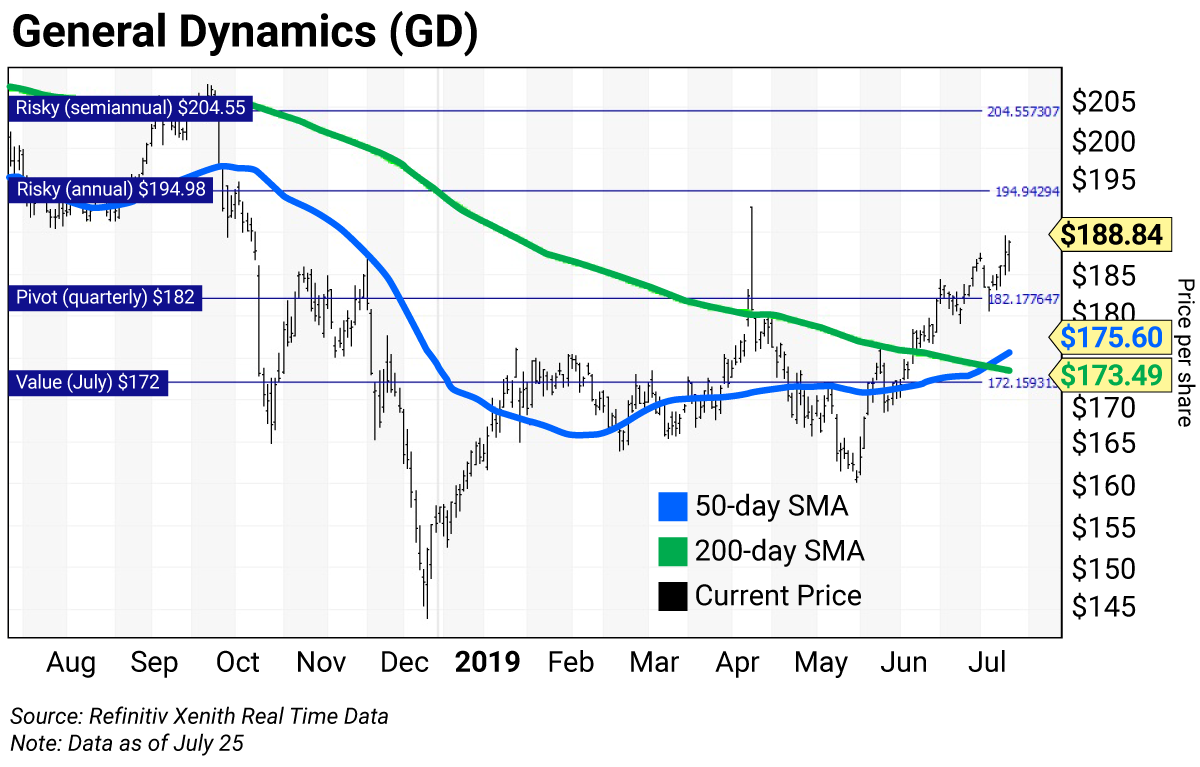
General Dynamics reported its second quarter (Q2) earnings before the opening bell Tuesday. It beat on earnings per share (EPS) and revenue. Orders for Gulfstream jets rose. IT orders for the Department of Defense surged. Combat systems revenue jumped. The overall order backlog totaled $103.2 billion. The stock’s price-to-earnings (P/E) ratio is 16.28, and its dividend yield is 2.21%.
The daily chart for GD shows the stock confirmed a “golden cross” on July 19, when its 50-day simple moving average (SMA) rose above its 200-day SMA. This indicates that higher prices lie ahead.
The stock is above a quarterly pivot at $182 and above its monthly value level at $172. The stock is below its annual and semiannual risky levels at roughly $195 and $205.

Lockheed Martin beat expectations in its Q2 earnings report on Wednesday. All segments contributed: Aeronautics, Rotary, and Missile Systems & Fire Control. The overall order backlog totaled $136.7 billion. Its most important product is the F-35 fighter jet. The stock’s P/E ratio is 18.03, and its dividend yield is 2.46%.
The daily chart for LMT shows the stock has been above a “golden cross” since May 6, when its 50-day SMA rose above its 200-day SMA.
The stock is above its monthly and annual value levels at about $342 and $336, respectively, and testing its quarterly pivot at $367. (The semiannual risky level is above the chart at $391.50.)
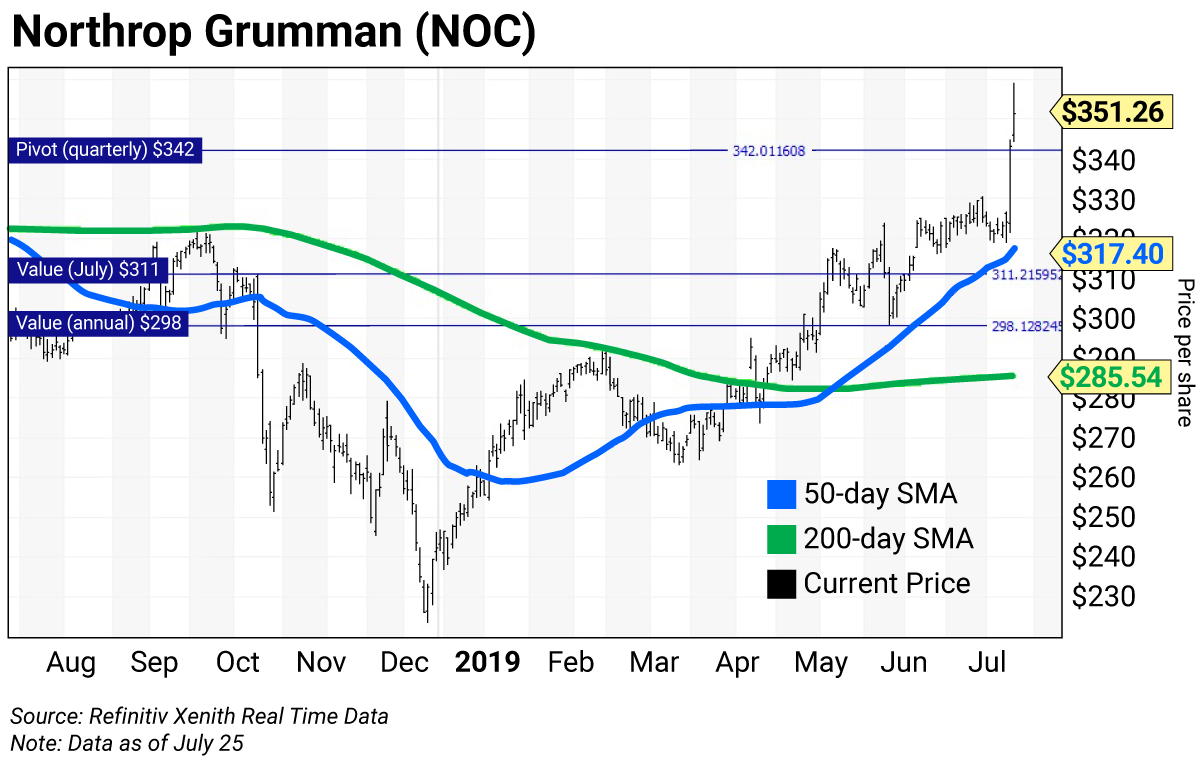
Northrop Grumman also beat expectations in its Q2 earnings report on Wednesday. Segment contributions were positive for Aerospace and Mission but were flat for Technology. The company raised forward guidance and reported a backlog of $63 billion. The stock’s P/E ratio is 15.80, and its dividend yield is 1.63%.
The daily chart for NOC shows the stock has been above a “golden cross” since May 22, when its 50-day SMA rose above its 200-day SMA.
The stock is above its monthly and annual value levels at $311.22 and $298.16, respectively. It’s quarterly pivot is $342. (Its semiannual risky level sits above the chart at $376.)
How to read daily charts
The charts you’ll see in these pages are designed to help you determine the best price levels at which to add to a position on weakness or reduce holdings on strength.
I developed the technical parameters for the charts following the crash of 1987, using rigorous back-testing to come up with a methodology that resulted in the fewest false signals.
Daily charts provide a roadmap of how a stock has traded over the last 52 weeks and typically cover a time horizon of a rolling three to five weeks.
The daily bars (in black) show the high, low, and close for each day of the last 52 weeks, ending in the current price. The blue line is the 50-day simple moving average (SMA). The green line is the 200-day SMA. These averages show levels of support or resistance as the stock trends higher or lower. (You can read more about SMAs here.)
Value, pivot, and risky levels
The horizontal chart lines are the value, pivot, and risky levels. These lines pinpoint buy and sell levels and are a great tool for maximizing gains and limiting losses on stocks you plan to hold long-term.
Risky level: sits above where the stock is trading.
Pivot level: often sits right around where the stock is trading. A pivot level is a value level or risky level that was violated within its time horizon. Pivots act as magnets that have a high probability of being tested again before the time horizon expires.
Value level: sits below where the stock is trading.
The general idea is to buy around a value level line and reduce holdings around the risky level line. You can rebuild your position on weakness.

 | Rich Suttmeier Founder & CEO, Global Market Consultants |


