

The U.S. banking system is shrinking… making the role of the “too big to fail” banks more important.
These include Bank of America (BAC), Citigroup (C), JPMorgan Chase (JPM), and Wells Fargo (WFC). And any investor with a portfolio of bank stocks should choose among these names.
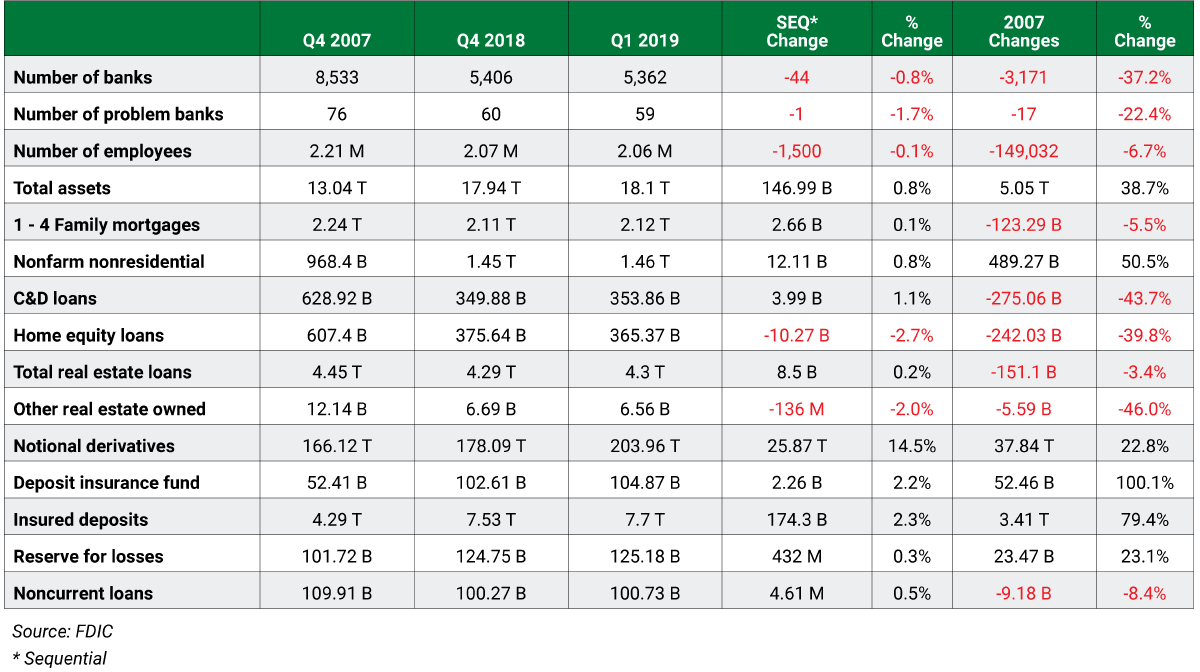
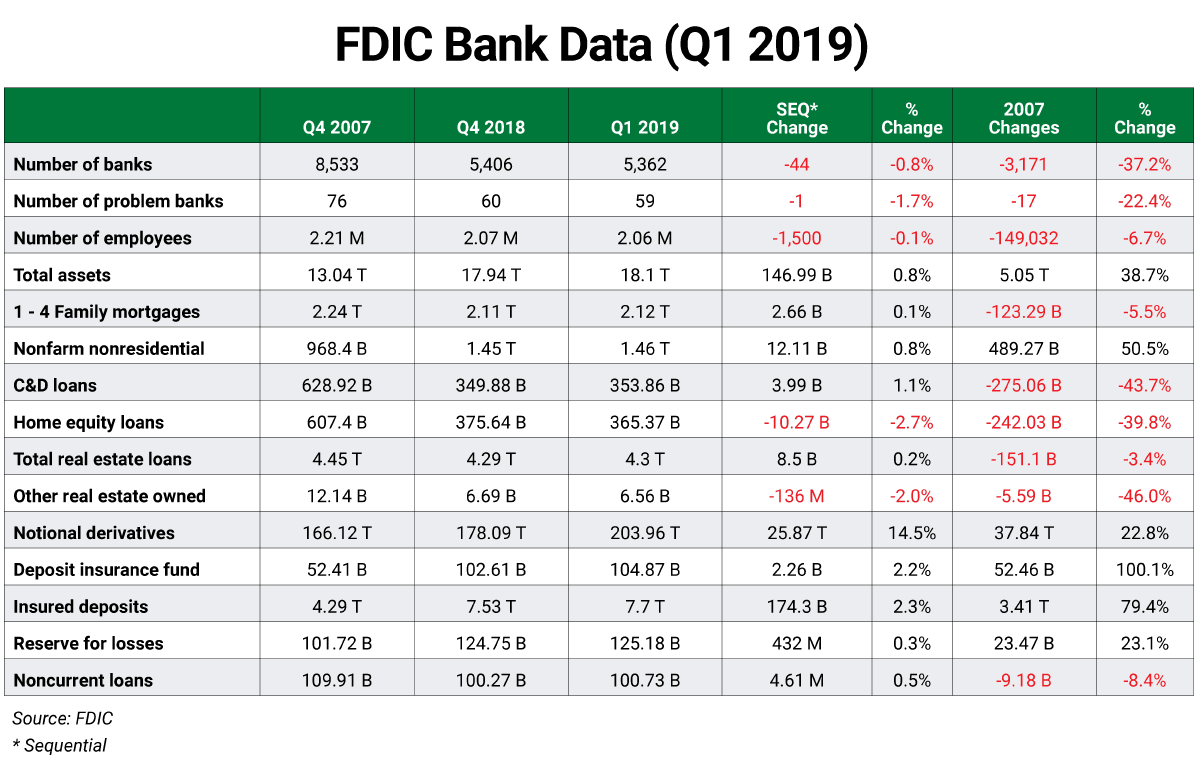
I’ll provide the levels at which to buy these stocks below, but first let’s break down the first quarter (Q1) 2019 FDIC Quarterly Banking Profile (QBP). Based on its data, the number of financial institutions and employees is shrinking. Since the end of 2007, the number of banks is down 37.2%, and the number of banking employees is down 6.7%.
The FDIC QBP is the balance sheet for the U.S. economy. FDIC Chairman Jelena McWilliams reported that the Q1 2019 numbers show the U.S. banking system is strong, but warns that banks must be prudent in their lending procedures:
The competition to attract deposit and loan customers is strong, and therefore banks need to maintain rigorous underwriting and prudent risk management. These factors have increased banks’ exposure to interest rate, liquidity and credit risk. Attention to these risks will position banks to be more resilient in sustaining lending through the downside of an economic cycle.
A scorecard of the key Q1 metrics (since 2007)
- Total Assets were reported at $18.1 trillion, up 38.7% since 2007.
- Residential mortgages (1-to-4 family structures) represent mortgage loans on the books of our nation’s banks. Production rose to $2.1 trillion in Q1, still 5.5% below the pace at the end of 2007. The big banks have reduced staff in their mortgage origination activities.
- Nonfarm/nonresidential real estate loans have expanded to a record $1.5 trillion in Q1, up 50.5% from 2007. The banking system now faces the risk of loan defaults related to closing retail stores and malls.
- Construction & development loans (C&D) rose to $353.9 billion in Q1, down 43.7% from 2007.
- C&Ds represent loans to community developers and homebuilders to finance planned communities. This was the Achilles heel for community banks, and the reason more than 500 banks were seized by the FDIC bank failure process since the end of 2007.
- Home equity loans (HELOCs) declined another 2.7% to $365.4 billion, down 39.8% from 2007. HELOCs represent second lien loans to homeowners who borrow against the equity of their homes. Regional banks typically offer HELOCs, but these loans continue to decline quarter over quarter despite the dramatic rise in home prices.
- Total real estate loans rose to $4.3 trillion in Q1 to $4.29, down 3.4% from 2007.
- Other real estate owned declined to $6.56 billion in Q1, down 46% from 2007 as formerly foreclosed properties return to the market. (This asset category peaked at $53.2 billion in Q3 of 2010.)
- Notional amount of derivatives, where many trading risks reside, totaled $203.9 trillion, up 22.8%.
- The Deposit Insurance Fund (DIF) balance is $104.9 billion, up 100.1%. The DIF represents the dollars available to protect insured deposits. These monies are funded by all FDIC-insured institutions via annual assessments, with the largest banks paying the largest amounts.
- Insured deposits rose to $7.7 trillion, up 79.4% as savers seek the $250,000 deposit insurance guarantee (available at each bank in which a saver has insured deposits).
- The DIF fund was mandated to have 1.35% insured deposits by the end of September 2020, and this requirement has already been met—the current reading is 1.36%.
- Reserves for losses rose slightly to $125.2 billion in Q1, but it’s up 23.1% since 2007. This is a sign of caution in the banking system.
- Noncurrent loans rose slightly to $100.7 billion in Q1, down 8.4% since 2007.
The four biggest banks control more than 40% of the assets in the banking system and are assessed much more than the smaller banks.
These banks also faced numerous regulatory fines over the last 12 years. Yet last week they passed recent stress tests with flying colors. Now you’ll see increased share buyback plans and increased dividends.
Trading strategy
For the following stocks, buy on weakness to value levels and reduce holdings on strength to risky levels, unless otherwise noted. For more details on using these levels, see the box below.
Bank of America (BAC)
Value levels: Monthly $28.80 and annual $24.07
Risky levels: Semiannual $31.16 and quarterly $31.90
Citigroup (C)
Value levels: Monthly $63.53 and and annual $55.22
Pivots: Semiannual $67.85 and quarterly $68.13. Reduce holdings if the stock fails to hold these levels.
JPMorgan Chase (JPM)
Value levels: Monthly $105.09 and annual $102.64
Risky levels: Semiannual $118.51 and and quarterly $120.14
Wells Fargo (WFC)
Value level: Monthly $43.41
Risky level: Annual $63.29
Pivots: Semiannual $47.99 and quarterly $47.98
How to use levelsThe horizontal chart lines I often show in my charts are proprietary value, pivot, and risky levels. These lines pinpoint buy and sell levels on stocks you plan to hold long term. The idea is to buy around a value level and reduce holdings around a risky level. You can rebuild your position on weakness. Risky level: sits above where the stock is trading; indicates where to sell. Pivot level: often sits right around where the stock is trading. A pivot level is a value level or risky level that was violated within its time horizon. Pivots act as magnets that have a high probability of being tested again before the time horizon expires. sits below where the stock is trading; indicates where to buy. |

 | Rich Suttmeier Founder & CEO, Global Market Consultants |
Editor’s note: One famous hedge fund manager said “it would take a meteor to crash bank stocks today”… But if you’re one of the many Americans who can’t stomach big banks post-crisis, there’s one that’s cutting investors a $60 billion paycheck. It’s both an income and a growth play, making it Frank’s No. 1 banking pick today. But it won’t remain at today’s levels long…
To access his full report, click here.


