
President Trump has been touting a resurgence in the manufacturing areas of the U.S.
That’s overstated… In 2017, home construction in counties that rely on manufacturing jobs outpaced the rest of the nation… But home construction has since dropped in these regions. And as NAHB chief economist Robert Dietz stated quite tellingly, “This correlation indicates that as housing goes, so goes the economy.”
Last week, I warned about inflating household debt and recession risk.
Home prices remain too high… and new home sales are at a pace at least 50% below the July 2005 peak of 1.3 million. Sales of new single-family homes plunged 12.8% in July—from a lofty 728,000 in June to 635,000.
Year over year (YoY) home sales climbed 4.3%, but new home sales lag dramatically from that 2005 peak.
The S&P CoreLogic Case-Shiller 20-City Composite Home Price NSA Index (SPCS20) measures the value of residential real estate in 20 major U.S. metropolitan areas.
According to the current SPCS20 (as of June 2019), home prices had a YoY gain of 2.1% in June—down from 2.4% in May. The biggest gains were in Phoenix, Las Vegas, and Tampa as homeowners move to locations where state, local, and property taxes are lower.
The SPCS20 peaked in July 2006—one year following the peak in the homebuilder stocks. This index declined by 35.1% to a low in March 2012, when the trend in home price rises returned to the historical trend of matching the rate of inflation.
Instead of rising slowly since then, the home price bubble re-inflated. From the low, home prices are up 62.3%—5.4% above the prior peak. For homes to be affordable, household income since March 2012 would also have to gain by a similar percentage. But according to Wall Street economists, most U.S. households continue to live paycheck to paycheck. And household debt is rising.
Last month, I gave trading guidance for the five major homebuilders. Most have outperformed the stock market in a shaky housing market… and are nearing risky levels.
But D.R. Horton is the only major home builder that has set higher highs than its July 2005 high of $42.82. The stock’s all-time intraday high of $53.32 was set in January 2018, and its 2019 high is $50.64—set on August 22.
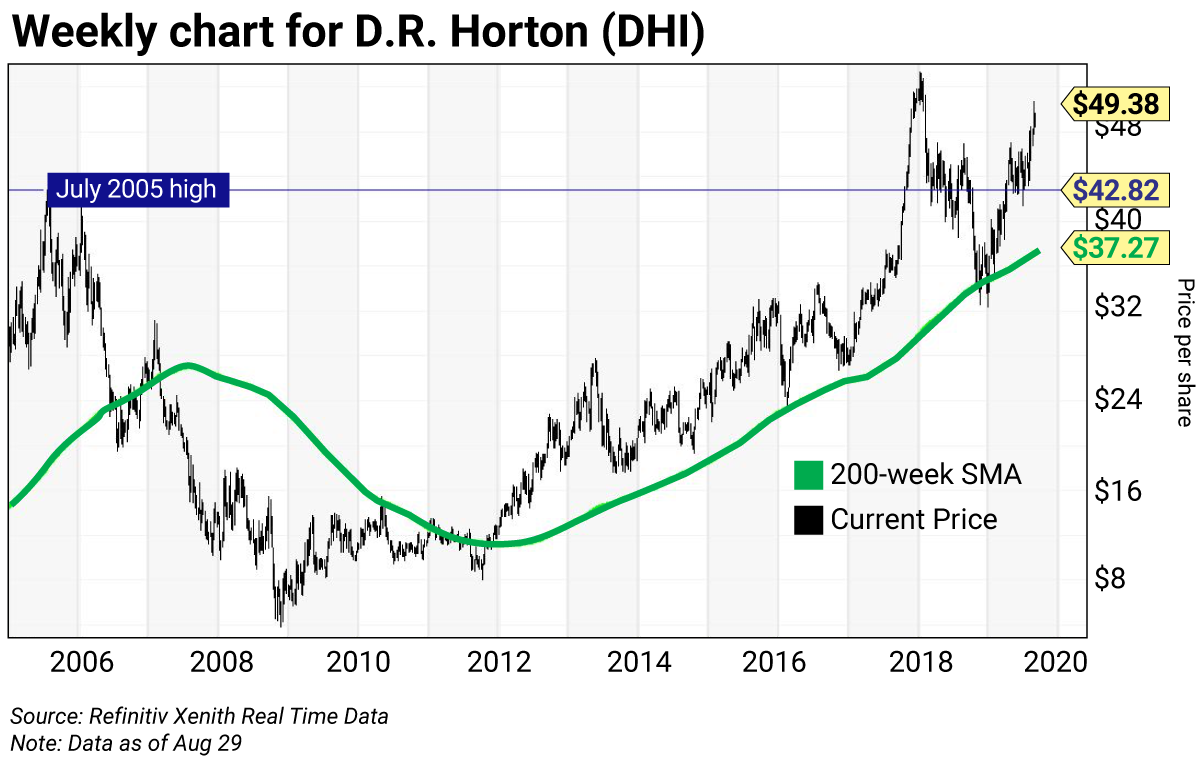
The horizontal line in D.R. Horton’s weekly chart represents the July 2005 high at $42.82. In green is the 200-week simple moving average (SMA) or “reversion to the mean” at $37.27. Note how the stock tracked this moving average as an uptrend since the week of December 2, 2011, when the average was $11.20.
Homebuilder stocks are cheap when their P/E ratio is below 9.00—and today’s reading for DHI is elevated at 11.80.
This means it’s time to reduce holdings…
Trading Strategy
The current value, pivot, and risky levels for D.R. Horton aren’t actionable.
My recommendation is to reduce holdings on strength to the stock’s all-time intraday and 2019 highs at $53.32 and $50.64.

 | Rich Suttmeier Founder & CEO, Global Market Consultants |