On July 16, the National Association of Home Builders (NAHB) announced its Housing Market Index (HMI) for July inched up a point to 65. The NAHB reports solid demand for single-family homes, but is concerned about labor shortages, limited buildable lots, and rising construction costs.
This makes affordability a challenge for prospective buyers. Home price increases continue to outpace income increases. Also, be aware that property taxes and home insurance costs are on the rise. Lower mortgage rates haven’t been able to offset the increased costs.
On July 17, the U.S. Department of Housing and Urban Development reported that single-family housing starts increased by 3.5% in June to 847,000 units. The overall housing starts data showed a decline of 0.9% on a slowdown in apartment and condo construction
Technical breakdown
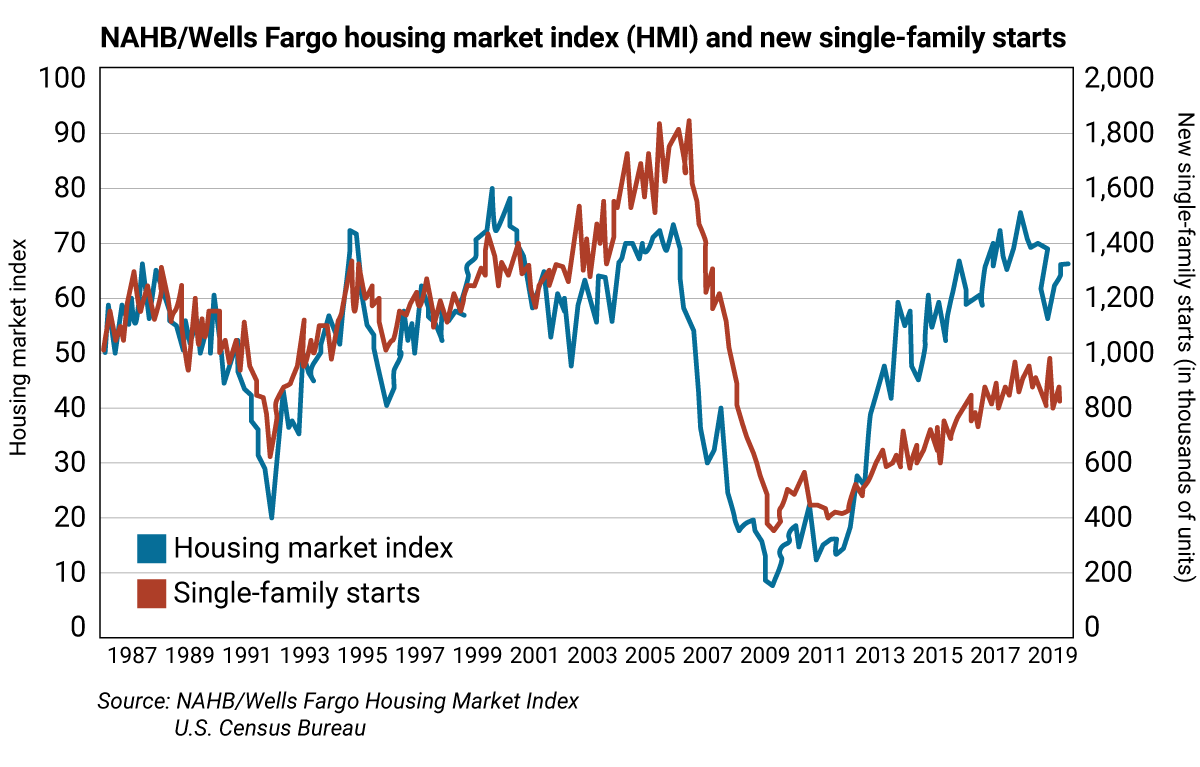
In today’s chart, the blue line is the HMI and the red line is single-family starts (based on the month prior). Note that single-family starts peaked around 1.8 million in mid-2005, which is when the homebuilder stocks peaked.
In a robust housing market, starts are higher on the graph than the index. The market for single-family starts is thus a drag on the U.S. economy. Remember, under the new tax law, the tax deduction for state, local, and property taxes is limited to $10,000.
How to use trading levels
Value, risky, and pivot levels are proprietary trading levels based on closing price inputs at the end of each month, each quarter, mid-year, and year end. They’re a great tool for pinpointing when to add to a position and when to reduce holdings on stocks you plan to hold long term.
Risky level: sits above where the stock is trading
Pivot level: often sits right around where the stock is trading. A pivot level is a value level or risky level that was violated within its time horizon. Pivots act as magnets that have a high probability of being tested again before the time horizon expires.
Value level: sits below where the stock is trading
The general idea is to buy around a value level line and sell around the risky level line. You can rebuild your position on weakness.
Trading strategy
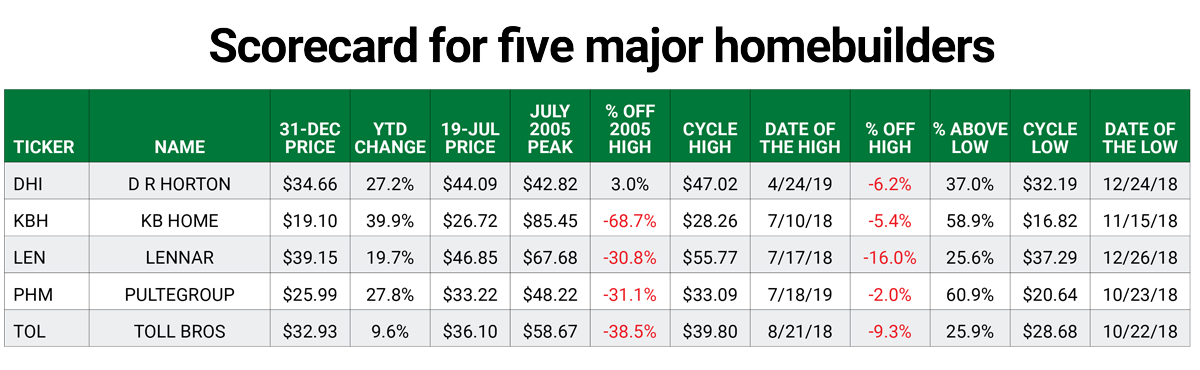
The major homebuilder stocks to focus on are D.R. Horton Inc (DHI), KB Home (KBH), Lennar Corp (LEN), PulteGroup (PHM), and Toll Brothers Inc (TOL). They’ve outperformed the stock market in a shaky housing market, and some are nearing risky levels. Here’s the performance breakdown… and levels at which to buy and reduce holdings.
D. R. Horton (DHI)
Reduce holdings on strength to semiannual and quarterly risky levels at $47.84 and $49.95, respectively. DHI’s monthly and annual pivots are $44.91 and $45.79, respectively.
KB Home (KBH)
Reduce holdings on strength to semiannual and quarterly risky levels at $27.19 and $27.23, respectively. KBH has a monthly pivot at $26.94 and an annual value level at $21.10.
Lennar (LEN)
Reduce holdings on strength to monthly and annual risky levels at $51.46 and $64.25. LEN has semiannual and quarterly pivots at $47.57 and $49.46, respectively.
PulteGroup (PHM)
Reduce holdings on strength to annual risky level at $34.20. PHM has monthly and quarterly pivots at $33.43 and $33.42, respectively. A semiannual value level is $31.28.
Toll Brothers (TOL)
Reduce holdings on strength to annual risky level at $48.16. It has monthly and quarterly pivots at $37.62 and $37.19, respectively. A semiannual value level is $33.34.

 | Rich Suttmeier Founder & CEO, Global Market Consultants |