
The inflating debt bubble on Main Street indicates recession risk…
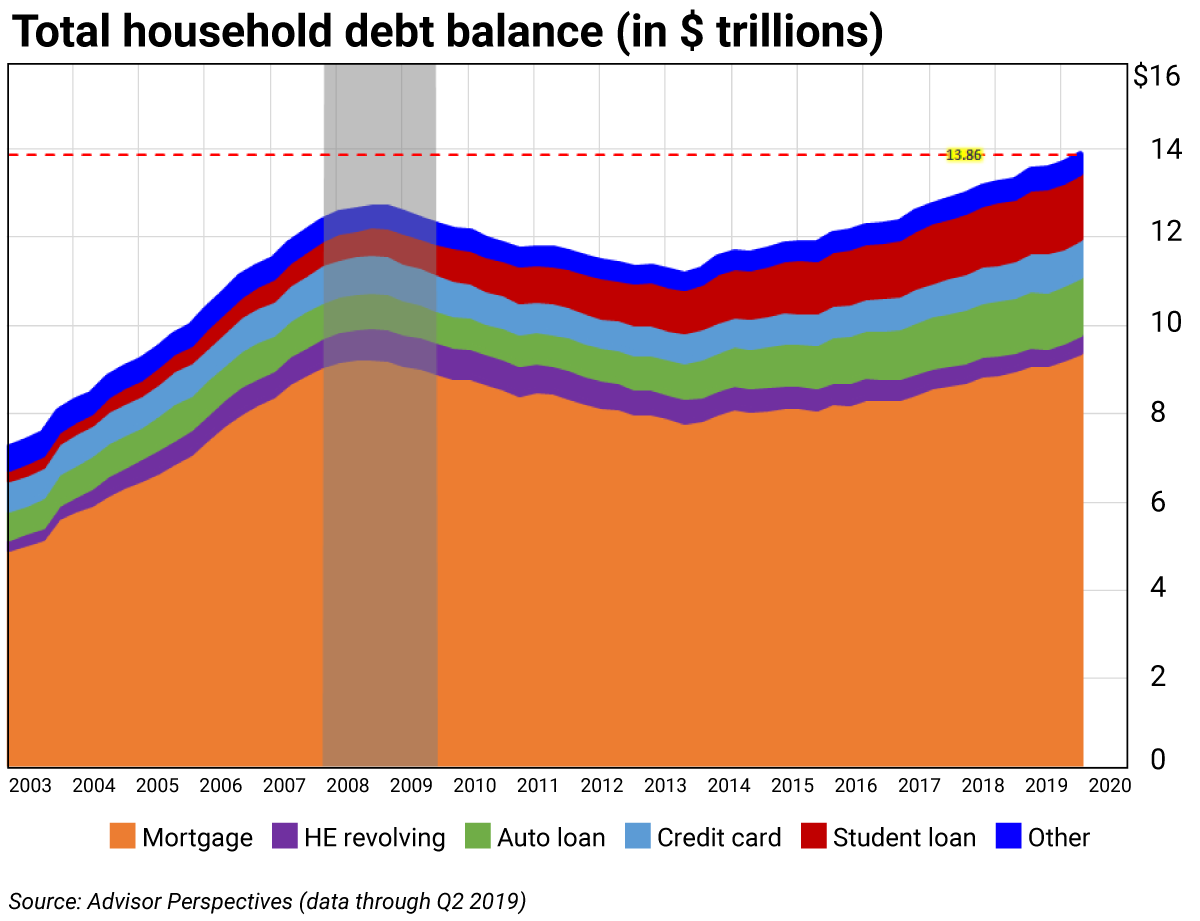
U.S. household debt rose by 1.4% (or $192 billion) in the second quarter (Q2) of 2019 to $13.86 trillion, according to the New York Federal Reserve Bank’s Center for Microeconomic Data.
This marks the 20th consecutive quarterly rise and inflates the debt bubble to $1.2 trillion higher than the previous peak… That was in Q3 2008, at $12.68 trillion—just as the Great Credit Crunch was imploding.
It tells me the U.S. economy is already in a recession. And as you’ll see, it’s putting the squeeze on big banks. I’ll briefly unpack the economic data and tell you the levels at which to add to—and reduce—your big bank positions.
The chart above shows troubling increases in auto loans, credit card balances, and mortgage balances.
In Q2 2019:
- Auto loans were up $17 billion to $1.3 trillion
- Credit card debt was up $20 billion to $1.03 trillion
- Student loans were down $8 billion to $1.48 trillion
- Mortgage loans rose by $162 billion to $9.4 trillion
Many of the auto loans are subprime loans. Banks hiked credit card rates during the economic recovery. Home prices are in a reinflated bubble, and sales of single-family homes are lagging at 50% of potential.
Mortgage loans, the largest portion of household debt, are now higher than the $9.3 trillion peak in Q3 2008. Approximately $5 trillion of these loans are held by government-backed Fannie Mae and Freddie Mac.
Among FDIC-insured financial institutions, 1-to-4 family mortgage loans totaled $2.12 trillion at the end of Q1 2019. This is down 5.5% from the end of 2007.
The Fed doesn’t care about the rising costs of living on Main Street, and thus will miss this recession—just as it missed the Great Recession of 2008.
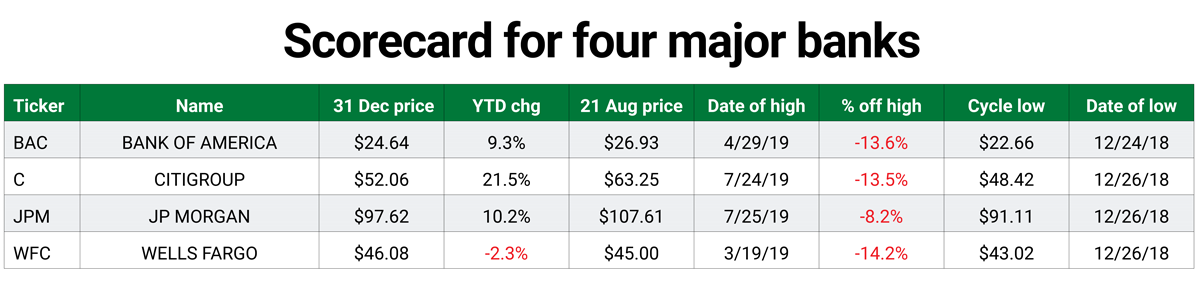
But it’s already showing up in the financial sector. In the table below, notice how three of the four are in correction territory—at more that 10% off their highs.
Trading Strategy
(See box below on using trading levels)
Bank of America (BAC)
Buy on weakness to its annual value level at $24.07.
Reduce holdings on strength to its monthly, semiannual, and quarterly risky levels at $28.78, $31.16, and $31.90, respectively.
Citigroup (C)
Buy on weakness to its annual value level at $55.22.
Reduce holdings on strength to monthly, semiannual, and quarterly risky levels at $65.86, $67.85, and $68.13, respectively.
JPMorgan Chase (JPM)
Buy on weakness to its monthly and annual value levels at $104.93 and $102.64, respectively.
Reduce holdings on strength to its semiannual and quarterly risky levels at $118.51 and $120.14, respectively.
Wells Fargo (WFC)
Buy on weakness to its monthly value level at $41.30.
Reduce holdings on strength to its annual risky level at $63.29. Semiannual and quarterly pivots are $47.99 and $47.98, respectively.
How to use trading levels
Value, pivot, and risky levels on a chart (see example here) pinpoint strategic buy and sell levels. They’re a great tool for maximizing gains and limiting losses on stocks you plan to hold long-term.
Risky level: sits above where the stock is trading
Pivot level: often sits right around where the stock is trading. A pivot level is a value level or risky level that was violated within its time horizon. Pivots act as magnets and have a high probability of being tested again before the time horizon expires.
Value level: sits below where the stock is trading
The general idea is to buy around a value level line and reduce holdings around the risky level line. You can rebuild your position on weakness.

 | Rich Suttmeier Founder & CEO, Global Market Consultants |