
Nike had its swoosh whacked after missing earnings on June 27. Many analysts on Wall Street thought the stock was immune to tariffs and currency volatility…
Today, we’ll examine the daily and weekly charts… And I’ll tell you the levels at which to add to—and reduce—your Nike (NKE) position.
The company had beaten earnings per share (EPS) estimates every quarter since December 2012…
But the winning streak ended abruptly with its earnings report for fourth quarter (Q4) and full year 2019 ended May 31. Still, shares didn’t react negatively to this report.
The stock had already set its all-time intraday high of $90 on April 18… and it set a secondary high of $89.87 on July 15.
Bank of America/Merrill Lynch assigned an “underperform” rating, citing new concerns related to demand for apparel and athletic shoes, as well as the impact of tariffs. Some folks were also unhappy about Nike’s seemingly political move to pull a limited-edition sneaker featuring the “Betsy Ross flag” due to perceived white supremacy symbolism.
Plus, Nike’s not cheap, as its P/E ratio is elevated at 31.72—with a dividend yield of just 1.11%.
But let’s see what the chart numbers say…
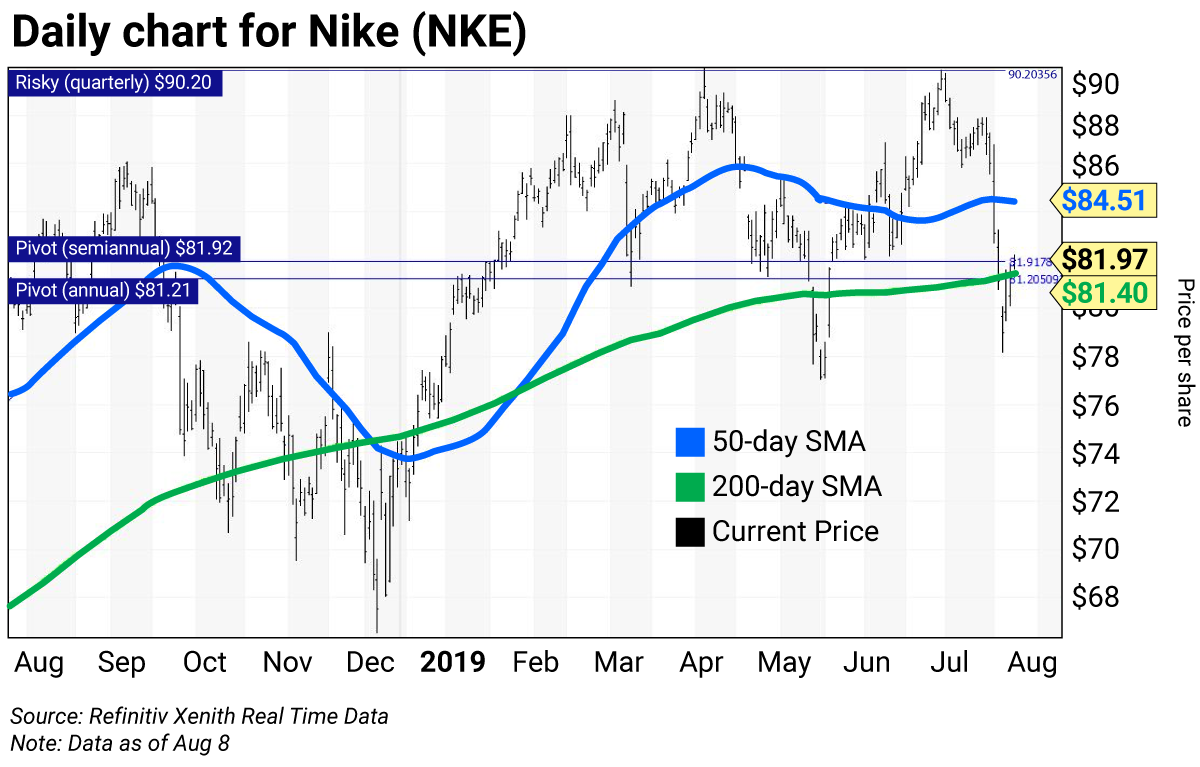
The daily chart for Nike shows the formation of a golden cross on February 13, when the 50-day simple moving average (SMA) rose above the 200-day SMA, indicating higher prices would follow. This tracked the stock to its all-time intraday high of $90 on April 18. Today the stock is trading around its 200-day SMA at $81.40, with its 50-day SMA at $84.51.
The horizontal lines are Nike’s strategic trading levels:
- Risky (monthly) $90.87 (above chart)
- Risky (quarterly) $90.20
- Pivot (semiannual) $81.92
- Pivot (annual) $81.21
Value, pivot, and risky levels
Value, pivot, and risky levels pinpoint buy and sell levels and are a great tool for maximizing gains and limiting losses on stocks you plan to hold long-term.
Risky level: sits above where the stock is trading
Pivot level: often sits right around where the stock is trading. A pivot level is a value level or risky level that was violated within its time horizon. Pivots act as magnets that have a high probability of being tested again before the time horizon expires.
Value level: sits below where the stock is trading
The general idea is to buy around a value level line and reduce holdings around the risky level line. You can rebuild your position on weakness.
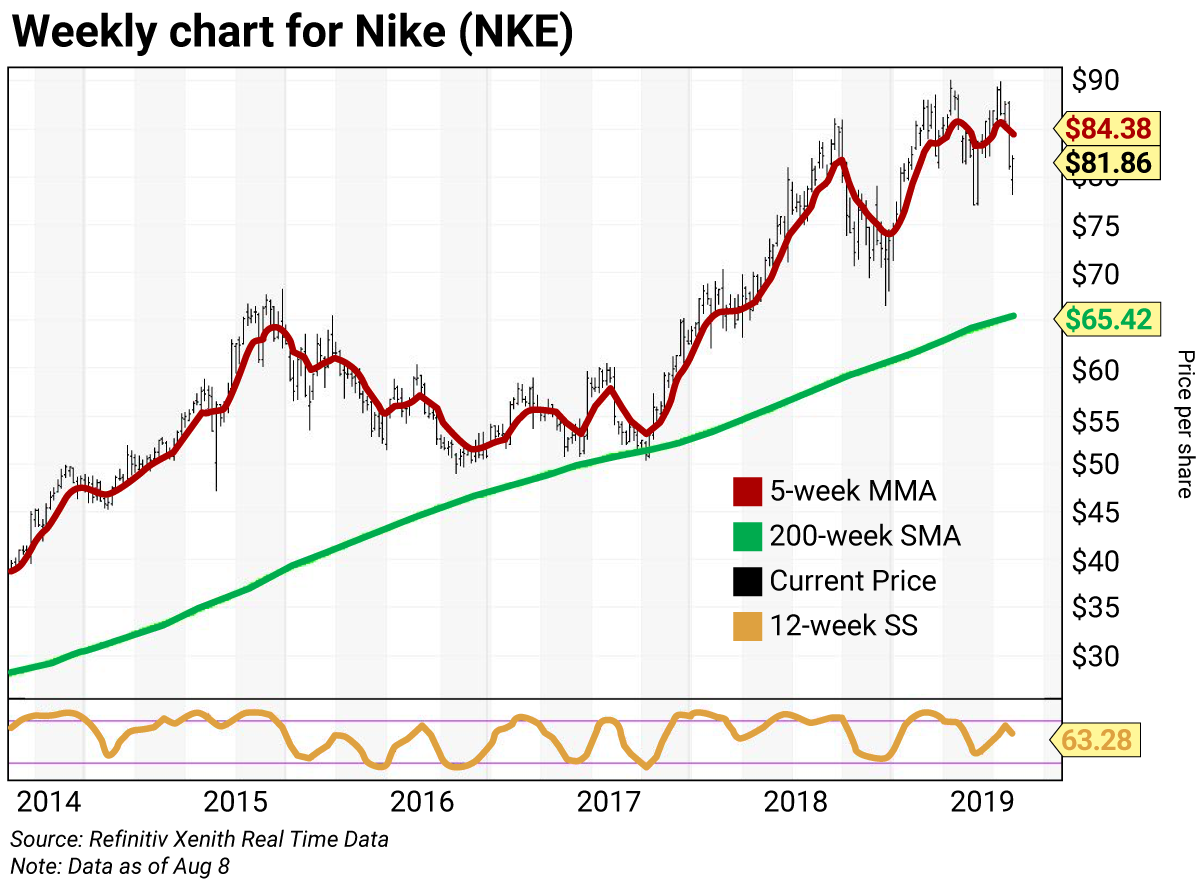
The weekly chart for Nike is negative, with the stock below its five-week modified moving average (MMA) of $84.38. The stock is well above its 200-week SMA or “reversion to the mean” at $65.42. This key average was last tested as a buying opportunity during the week of October 20, 2017, when it was $51.46.
The 12-week slow stochastic reading is projected to end this week at 64.21—down from 69.75 on August 2. (Readings above 80 are considered overbought, and readings below 20 are considered oversold.)
Trading strategy:
Buy Nike (NKE) now. Add to positions on weakness to its “reversion to the mean” at $65.42. Reduce holdings on strength to the quarterly and monthly risky levels at $90.20 and $90.87, respectively.

 | Rich Suttmeier Founder & CEO, Global Market Consultants |
Editor’s note: We hope you find Rich’s technical trading advice valuable. Let us know what you think.