
Today, I’m proud to introduce our new guest editor, technical trader Richard Suttmeier. He’s about to tell you how to read the chart of the most popular stock in the world—a name I bet most of you own. And give you actionable advice…
But first, a little backstory…
In 2006, Rich invited me to speak at the prestigious Princeton Club in New York City.
There were only about 30 people in attendance…
But they were high-profile research analysts, leading economists, and senior executives who worked for publicly traded companies.
My speech was 40 minutes long. I talked about how the markets had much more upside over the next 12 months… and why the economy would continue to see strong growth despite the Federal Reserve raising short-term interest rates.
I had plenty of data to support my thesis. But halfway during my speech, I drew a blank. I lost my train of thought. I felt like a comedian who forgot the punchline.
There was dead silence for about 30 seconds (which seemed like five minutes at the time). But I took a quick drink of water… gathered my thoughts… and everything came back to me.
It turned out to be a good speech. More importantly, I was right. The markets headed higher… and our economy grew 2.9% on the year… which was much stronger than most economists predicted.
Rich Suttmeier and I still joke about that day.
I was working at TheStreet.com with Rich at the time. He was one of the company’s best writers (his stories were always at the top of our most-read section, next to Jim Cramer). He loved my work, so he invited me to speak at the Princeton Club. I was truly honored.
Rich and I have remained friends ever since.
If you’re not familiar with Rich’s work…
He began his financial career in 1972 as a U.S. Treasury trader and trading manager. He’s been analyzing stocks for over 40 years… using both technical and fundamental analysis to find trading opportunities (long and short) that he passes on to his followers.
Rich writes for prominent financial sites including Forbes, Investopedia, and TheStreet.com. He’s also a regular guest on my Wall Street Unplugged podcast… where he shares lots of stock ideas with my audience.
Using his wealth of technical knowledge, Rich has created a proprietary system of market analytics. As you’ll see, no one can read a chart like Rich. He’s known for his uncanny ability to predict where a stock is headed next… And help his followers decide if it’s time to buy or sell.
Keep reading to learn what he has to say about Apple today…
—Frank
Today’s chart
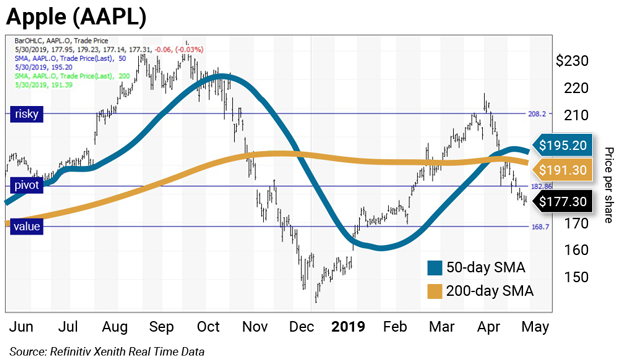
Daily charts provide a roadmap of where a stock has traded, which is used to predict the risk and reward for the stock in the future. I like to use a chart that shows daily bars covering the past 52 weeks.
If you’re new to technical trading, here’s how to read it:
The blue line is the 50-day simple moving average (SMA). The copper line is the 200-day SMA. The horizontal lines are value levels, risky levels, and pivots calculated from a proprietary system of analytics I developed.
Value level: sits below where the stock is trading
Pivot level: sits right around where the stock is trading
Risky level: sits above where the stock is trading
Below, I’ll tell you how to use these lines. They’re a great tool to maximize gains and limit losses on stocks you plan to hold long term.
Technical breakdown
The chart above shows intraday prices on May 30. Apple closed Wednesday, May 29, at $177.38, up 12.5% year to date and in bull market territory: 24.9% above its Jan. 3 low of $142.00. The stock is in a longer-term bear market: 24% below its all-time intraday high of $233.47, set on Oct. 3.
On May 6, the stock failed to hold its second quarter (Q2) pivot at $208.26, which was a warning to reduce holdings on the stock.
On May 13, the stock broke below its 50-day and 200-day SMAs at $195.20 and $191.39, respectively, warning us the stock would continue to trade lower.
On May 23, a second warning occurred when the stock gapped below its annual pivot at $182.85. The chart suggests downside risk to its semiannual value level at $168.72, which is the level at which to buy Apple on share price weakness.
The daily chart also shows the reaction to earnings reports. Apple’s last earnings report was released on April 30, and the positive reaction caused the reaction high of $215.31 on May 1.
Value levels and risky levels are based upon the last nine weekly, monthly, quarterly, semiannual, and annual closes. The first set of levels was based upon the Dec. 31 closes. The weekly level changes each week; the monthly level was changed at the end of January, February, March, and April; the quarterly level was changed at the end of March. The original semiannual and annual levels remain in play.
A pivot level is a value or risky level that was violated within its time horizon. A pivot acts as magnet—it has a high probability of being tested again before its time horizon expires.
My theory is: Nine years of volatility between closes are enough to assume all possible bullish or bearish events for the stock are factored in.
The fundamentals
Demand for iPhones is down significantly, thanks to tariffs. And Apple is trading at a point of weakness. Right now, it pays a 1.7% yield with a reasonably priced P/E ratio of 15. That’s cheap compared to the S&P 500, which has a P/E average of around 17.
Action to take
To capture share price volatility, buy on weakness to a value level and reduce holdings on strength to a risky level. In other words, whenever you’re long a stock, buy around the value line and reduce holdings once it gets too risky. You can rebuild your position on weakness.

 | Rich Suttmeier Founder & CEO, Global Market Consultants |