When is a pullback the start of something bigger?
As you probably know… stocks took a step back last week. The S&P 500 fell about 2.5%. The damage was worse for the tech-heavy Nasdaq Composite, which sank nearly 5%.
This may not seem too out of the ordinary, this pullback looks to be the start of something prolonged… And it’s not based on higher interest rates or slower growth—it’s based on the flow of Big Money.
How do I know?
Today, I’ll show you three different (but related) indicators signaling more pain is ahead.
Big Money Index leads the market
My favorite way to determine where stocks are heading is by looking at the Big Money Index (BMI).
It measures institutional money flowing in and out of stocks. Basically, when the line is heading higher, stocks should follow. But after last week, it’s falling now… which means we’re likely heading lower.
Below, you can see over a year of BMI action. I’ve included a line at the 80% level, which is the point at which stocks become overbought. It’s an important factor because we’ve been in overbought territory for the past three months—for 59 straight trading days beginning December 2…
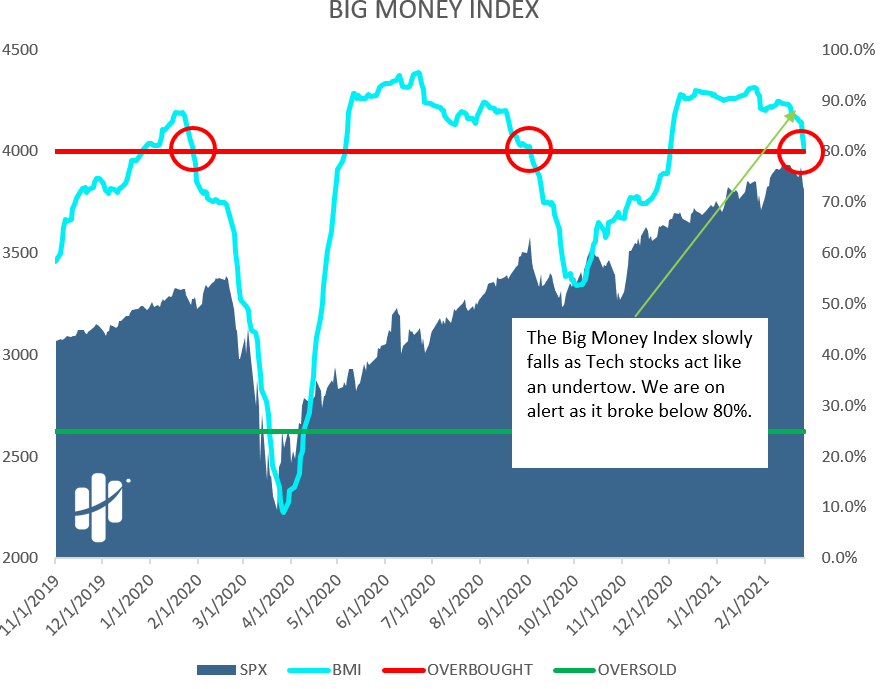
Look at what happened on Friday: The BMI broke down through the red line. That means the stock market is finally coming out of overbought territory.
Long-term, it’s a good thing. But it’s usually a bit painful in the short term.
I’ve circled the important signals. As you can see, this is the third time (in about a year) the market pulled back from overbought levels.
The last two times the BMI broke below the overbought level, we saw significant declines in stocks. Here’s what happened:
- January 29, 2020 (the left red circle): The pullback took a month to pick up steam. As COVID cases started to spread, the S&P 500 fell more than 30% from its highs, reaching the pandemic low on March 23.
- September 3, 2020 (the middle circle): The S&P 500 fell more than 6% over the next 14 trading days.
Let me be clear: I’m not suggesting a crash is near. I’m just paying attention to the data and preparing for a pullback. Based on recent history, I expect we’ll see declines similar in scale to what we saw back in September.
Now, let’s take a deep dive under the market’s surface.
Big Money selling is picking up
Following Big Money has its advantages. It helps us see what’s really going on in stocks.
If the BMI is falling, it means stock buying must be slowing.
Below, I’ve included my Big Money Stock Buys & Sells chart. It’s a daily look at the number of individual stocks seeing big, institutional buying or selling.
Green bars indicate the buyers are in control… while red bars mean there are more sellers:

I’ve circled the important signal on the chart. As you can see on the right, the selling is picking up. For the first time in months, we’re seeing red bars start to return. And those red bars act like gravity on the Big Money Index.
To complete our research, let’s do the same study for exchange-traded funds (ETFs). As you probably know, ETFs are portfolios of stocks that trade just like stocks. Checking up on the latest action in ETFs can give us additional details about the market’s health.
Below, I’ve included my Big Money ETF Buys & Sells chart. It’s a daily measure of extreme ETF trading. Green bars indicate buyers, while red bars are sellers.

Again, the important stuff is in the big circle to the right. We’re seeing a spike in ETF selling. And it’s a mix of sector funds and bond ETFs. The selling in bond ETFs make sense. Interest rates jumped higher last week, which puts pressure on fixed-income debt instruments.
The bottom line is this: Last week’s selloff looks like the start of something bigger. The last two times my Big Money indicator fell like this, stocks fell soon after.
In fact, the recent action lines up with what I saw in early February, when my data was pointing to lower stock levels. We’re now seeing the confirmation.
As alarming as this may be for some, it’s important to remember that pullbacks are part of the game.
Investors who stay prepared will be ready for buying opportunities during the pullback. That’s what I’ll be doing.
Near-term, conditions appear stormy. But medium-to-long term, stocks should keep doing what they’ve been doing… breaking higher.
If you’re curious how I’ll be handling things in the weeks ahead, keep an eye out for the launch of Curzio Research’s newest newsletter, The Big Money Report.
Editor’s note:
If you’re interested in following the smart money into the market, one of the easiest ways to do it is with The Dollar Stock Club.
Members receive a fully vetted stock pick almost every week from Frank’s extensive Rolodex of Wall Street insiders—for just $4 a month!
Right now, members are seeing gains like 100%… 130%… even 800%… with plenty more upside potential…
You won’t find a service that offers this level of value anywhere else.
Become a member today… and get the next pick delivered straight to your inbox.