In the stock market, sometimes the surfing is good… and sometimes it isn’t.
For the last three months, conditions have been fantastic. But we’re likely heading for a rough patch.
Here’s why…
My Big Money Index shows a massive shift happened last week. It’s similar to when an ocean tide goes out… As the buying “retreats,” it creates a challenging situation for investors.
As usual, the financial media missed the story. They’re focused on the sideshow happening in “meme” stocks like GameStop (GME).
As I’ll explain, the real story is bigger and more important. And it signals a shift for the entire stock market.
But, let me be clear. I’m a long-term optimist on stocks… not a big bad bear. I just follow the data. And right now, it’s flashing a “high tide” warning.
Big Money starts its descent
If you’ve read my commentary before, you know I follow the Big Money—the buying and selling done by institutional investors.
The last few months, these guys have been buying heavily. The data shows a rising tide of stock buying.
But, there are signs the tide has peaked… and will soon go out.
Below is a chart of the Big Money Index (BMI). It tracks where the Big Money is going. When the line is moving up, stocks tend to follow higher. When it starts to fall, like now—the inverse is true.
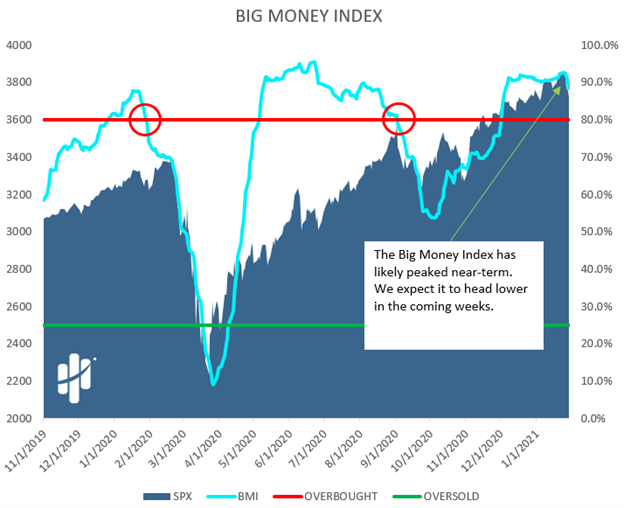
As you can see above, the blue line is tracking the Big Money. I’ve also included the S&P 500, so you can see the market’s performance. The Y-axis (on the right side) measures the percentage of stock buying. The higher the number, the more buying relative to selling.
We’re coming off an extremely overbought period where the buying topped 90%. You can see how the BMI stayed around this elevated level for nearly two months. When it starts to fall, like now… that’s the signal that under the surface, things are changing. Selling is picking up.
The red line is the overbought threshold of 80%. Typically, markets have to see a lot of buying to break above that area. When we fall out of that area, markets tend to fall.
I’ve circled prior times when the index fell out of overbought territory. In both cases, when the BMI broke below the red line, it signaled the tide was going out for stocks. The first pullback was a steep correction in March 2020. The second pullback happened in October, when stocks fell about 10% from their September highs.
I expect the BMI will head lower in the coming weeks. And if that’s the case, I believe stocks will follow.
Now, let’s dig a little deeper. Under the surface of the market are waves of unseen activity… just like the ocean. And every now and then a big shift occurs, like what happened on Wednesday.
Some headlines indicate that Wednesday saw the highest volume ever traded for stocks. And that’s what my data found too. A lot of money was changing hands… signifying a major trend change.
Below, I’ve included a graph of the daily trading signals in stocks. Each vertical bar shows how many stocks are trading on outsized volume on a given day. Basically, when a stock trades on unusually high volume, a signal flashes. But, every now and then, an extreme number of stocks have this type of activity… seemingly out of nowhere.
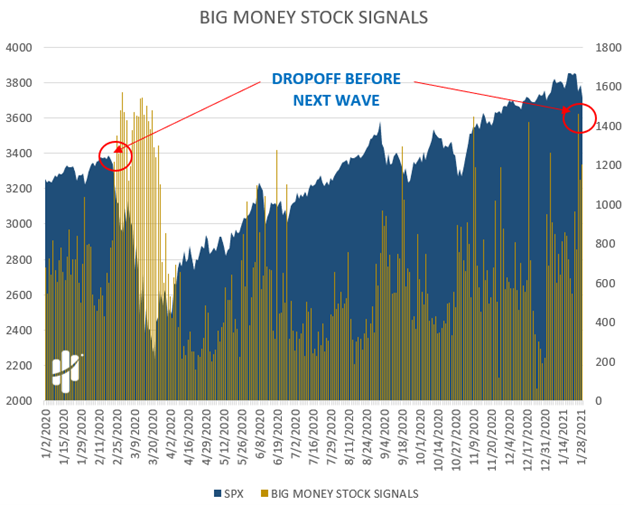
The signal from Wednesday is circled on the right. It tells us that more than 1,400 stocks traded above average volume.
On the left, I’ve circled the last time we saw similar activity—back in February 2020. It was the early warning sign that a shift was starting. You can see how many stocks traded on big volumes (the tall vertical lines) in February…
The left circle preceded the pandemic crash of March 2020.
Let me be clear, I DO NOT expect a selloff of a similar magnitude.
At this point, I expect a drop of around 10%. I see this pullback as technical in nature, and not driven by fundamentals.
Let’s keep going…
The BMI is constructed by tallying buy and sell signals.
Put simply, when the BMI is rising, there are more buy signals than sells.
When we take a closer look at the chart, there’s another troublesome sign. The buy signals appear to have crested. You can see how there has been a steady dropoff in green bars (buying activity)… making way for new red signals.
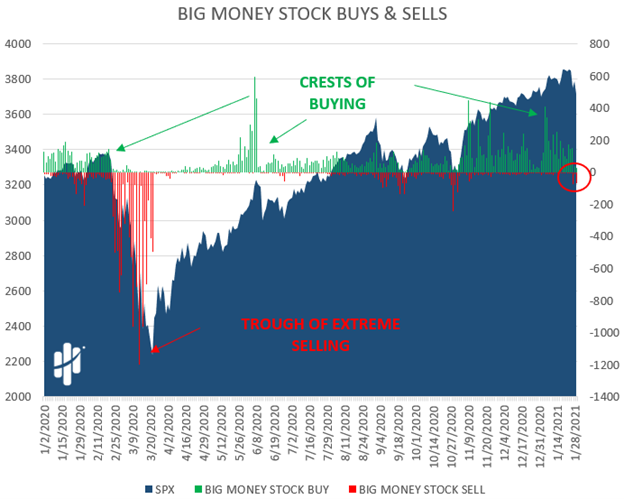
Take a look at the circle on the right side of the chart. It shows that Big Money buying slowed last week. In fact, on Friday it went negative, because sells outnumbered buys.
Sellers are here. And when they show up, lower levels tend to be in store for markets.
Red bars tend to be a magnet for more red bars. Those are sell signals… they indicate stocks traded lower on increased volume. It’s a sign the stock market is entering a new phase.
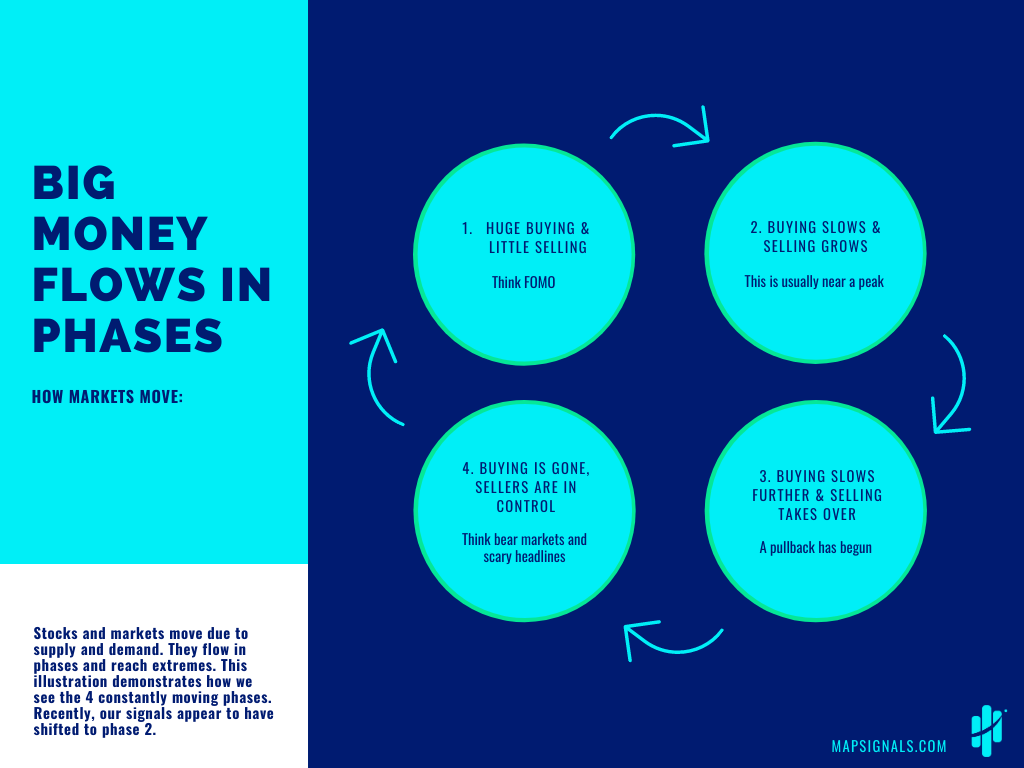
I realize these charts can be a lot to follow. So below, I’ve included a simple diagram explaining the phases of Big Money. I believe we’re entering phase 2:
The bottom line is this: The signs point to a major shift happening in the stock market right now.
The monster buying we’ve seen the past few months is starting to fade. That means we’ll likely see more selling—and lower prices—in the coming weeks.
This is what I explained to Frank on Wall Street Unplugged last month.
Don’t be distracted by the media. They’re focused on the sideshow happening in a small subset of stocks (driven by short squeezes). The big story is that the tide is going out.
Don’t get beached.
P.S. I’m currently putting the finishing touches on a new service for readers ready to profit from the best growth stocks in the market.
It’s called The Big Money Report.
Right now, it’s in beta testing and only available to Curzio One members. But we’ll be offering it to all Curzio readers soon. If the market pulls back as I expect, there will be a ton of great buying opportunities for subscribers…
Stay tuned for details.