
Successful traders always leave a little money on the table. You’re almost never going to sell right at the top or buy right at the bottom.
The best traders take a contrarian approach. It’s better to sell into strength—when the market is moving higher—rather than selling later when the market is heading lower.
It’s important to keep this contrarian approach in mind, because all the major stock market indexes are surging to new highs right now.
This recent strength is pushing the market into overbought territory, according to my trading system.
For example, the S&P 500 (SPX) is trading above its quarterly risky level (at 3,076) and its monthly risky level (at 3,089). The Dow Jones Industrial Average (which lists 30 companies) is within 3.5% of its quarterly risky level at 28,537. And the Nasdaq Composite is between its monthly and quarterly risky levels of 8,469 and 8,591, respectively.
That’s why I’m telling readers to reduce holdings in the stock market by at least 50%.
When the Dow, the S&P 500, and the Nasdaq are all rallying toward their monthly and quarterly risky levels, it’s time to take less risk.
Let’s focus on the weekly chart for the S&P 500. The S&P is the major benchmark for the stock market and it’s the first of the three major indexes to exceed its risky levels.
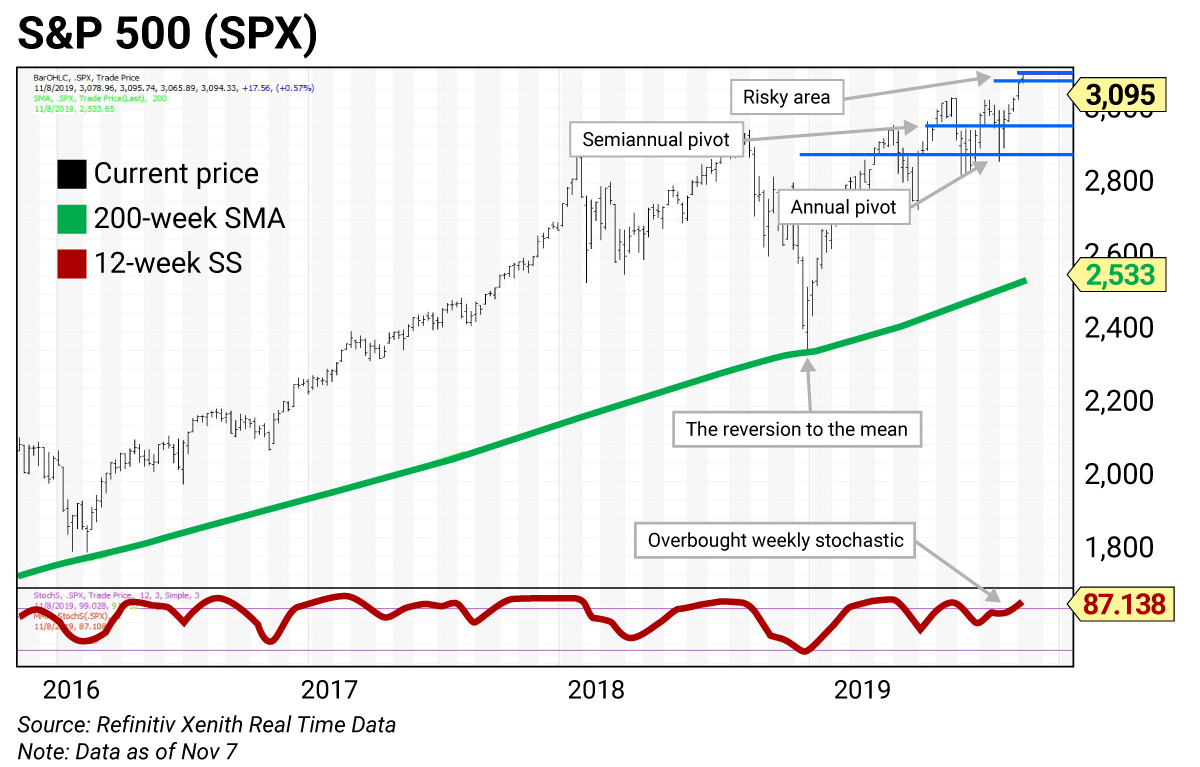
The S&P 500 is positive but overbought since it began trading above its five-week modified moving average (not shown) at 3,010.
Another warning comes from the 12-week slow stochastic (SS) reading. (It’s the red line shown at the bottom of the chart.) I introduced this indicator in last week’s discussion about Apple.
The 12-week SS reading measures how overbought or oversold a stock is. Whenever the reading goes over 90, it’s called an “inflating parabolic bubble.” It acts as a warning for a possible decline of 20% or more over the next three to five weeks.
The 12-week SS is projected to rise to 86.99 this week, up from 81.15 on November 1. That’s not quite at the “inflating parabolic bubble” stage, but it’s getting close.
Of course, most readers want to know how big of a potential decline we could see.
To get an idea of the downside, we can look at the 200-week simple moving average (SMA) or “reversion to the mean” line. As you can see in the chart, the S&P 500 tested this line nearly a year ago in late December 2018. It bottomed at 2,350 before resuming the uptrend we’re enjoying right now.
The green line shows the downside risk for the market as we head into early 2020. The “reversion to the mean” line is at 2,533—more than 18% below current prices.
Whenever the three major equity averages rally to risky levels (based on my proprietary analytics) simultaneously, it’s time to reduce holdings by 50%.
Even if the markets trend higher, you still have 50% of your holdings in the market.
I’ve made similar recommendations in the past. In March 2000, I made the correct call to reduce holdings in the Nasdaq by 50% with the index above 5,000. By the end of that year, the Nasdaq was below 2,500—down more than 50% from its March highs.
In late 2007, I made the call to reduce holdings in the stock market by 50%. It took a few months to play out, but we all remember the crash of 2008.
The chart dynamics I see today remind me of March 2000 and the end of 2007. The technical setup is too similar to ignore.
That’s why investors should sell to current strength in the three major averages as risky levels are tested. We chose to focus on the S&P 500.
S&P 500’s trading levels
- Risky (monthly): 3,089
- Risky (quarterly): 3,076
- Pivot (semiannual): 2,955
- Pivot (annual): 2,867
Trading strategy
Reduce holdings by at least 50% in the stock market with the S&P 500 above its quarterly and monthly risky levels at 3,075 and 3,089, respectively.
The nearby downside risk is to semiannual and annual pivots at 2,954 and 2,874, respectively. The longer-term downside risk is to the “reversion to the mean,” which is the 200-week SMA at 2,533.
How to use trading levels
The trading levels on my charts pinpoint strategic buy and sell levels. They’re a great tool for maximizing gains and limiting losses on stocks you plan to hold long-term.
Value levels and risky levels are based upon the last nine monthly, quarterly, semiannual and annual closes. The first set of levels was based upon the market closes on December 31. The original annual level remains in play.
Value level: Sits below where the stock is trading.
Pivot level: Often sits right around where the stock is trading. A pivot level is a value level or risky level that was violated within its time horizon. Pivots act as magnets and have a high probability of being tested again before the time horizon expires.
Risky level: Sits above where the stock is trading.
To capture share price volatility, investors should buy on weakness to a value level and reduce holdings on strength to a risky level.

 | Rich Suttmeier Founder & CEO, Global Market Consultants |
Editor’s note: If you’d like to hear more about how Rich’s trading system works, check out yesterday’s episode of Wall Street Unplugged. You’ll also hear about the 2-second trading service Rich is about to launch… and a few of his favorite ideas right now…


