
Editor’s note: If you’re looking to understand more about how Big Money can help with investing, join Luke this Wednesday at the MoneyShow for a free virtual presentation, Be in the 1% with Outlier Stocks. A Q&A with participants will follow.
It starts Wednesday, September 16 at 10:40 AM ET. Register free here. Hope to see you there…
Spotting market peaks can be challenging. Especially in a monster bull market.
Market veterans know that each market is different. The forces that drive a market today can be—and usually are—completely unique.
But at the heart of all markets is an exchange of supply and demand. And as a trader, you want to be on the right side of demand.
Think about it…
Markets trend up and down for weeks and months… similar to waves in the ocean. There’s the build up phase, and then it peaks (crests)..
To spot an overexcited, frothy market due for a correction, you have to be able to identify these peaks. And there’s one simple way to do it: Look at retail buying.
A great barometer for retail buying is ETFs (exchange-traded funds). These are packaged assets that trade on an exchange like a stock.
As I’ll show you, when there’s a ton of demand for ETFs, it’s typically a signal that a correction is coming.
Big ETF buying signals froth
After years of handling huge order flow for some of the largest firms on earth, I learned how to spot extreme events. At my firm, MAPsignals, we specialize in trying to measure buying and selling pressure in stocks. This includes ETFs.
While we can’t truly know when there is extreme buying, we have mounds of data that point to prescient signals.
Below is the MAPsignals Big Money ETF Index (BMI), which measures buying and selling in these funds. When there is evidence of big buying, look out below!
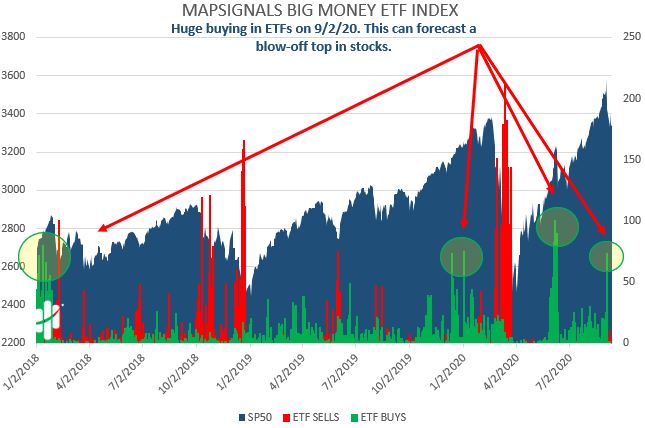
On 9/2/20, we saw a ton of ETF buy signals (the green circle on the far right). I’ve also circled prior times we’ve seen similar activity. Hopefully, you can see that these prior green spikes tend to line up around blow-off tops in the market.
You may recall that we saw this type of activity in June… And markets fell shortly after.
But, let’s not just use our eyes to make a determination. I went back and looked at all prior times we’ve seen buying like this. There are 10 examples.
The forward returns for the S&P 500 are below:
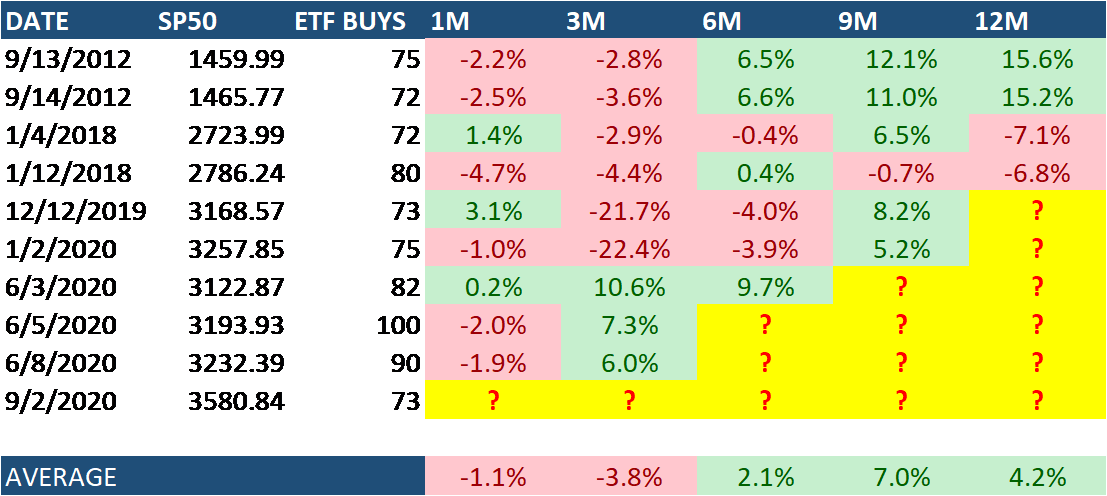
After activity like this, the one- to three-month returns are negative on balance. Keep in mind: Two of the 10 prior occurrences were in December 2019 and January 2020, before the pandemic crash in March.
But, the signal worked like a charm this go ‘round. Since September 2, the S&P 500 (SPY ETF) is down 6.61%. Chances are, we’ll see choppy market action in the coming weeks.
Bottom line: Pay attention to what mom-and-pop are doing. Extreme ETF buying tends to be a top-heavy indicator for the market.
And once it crests, you can use the pullback to load up on great stocks.
Editor’s note:Rich Suttmeier’s 2-Second Trader service takes the guesswork out of timing the market. The secret? Rich’s proprietary Black Box trading tool. This algo-based system can tell you when to buy or sell almost any stock—at any time. And it only takes two seconds…