
Gold is trading higher… and my favorite way to own it is Newmont Goldcorp Corp. (NEM). Today I’ll break down its weekly data over the past five years and the right price to buy on weakness.
(For details on how to read the chart and its indicators, see the info box at the bottom of this email.)
Technical breakdown
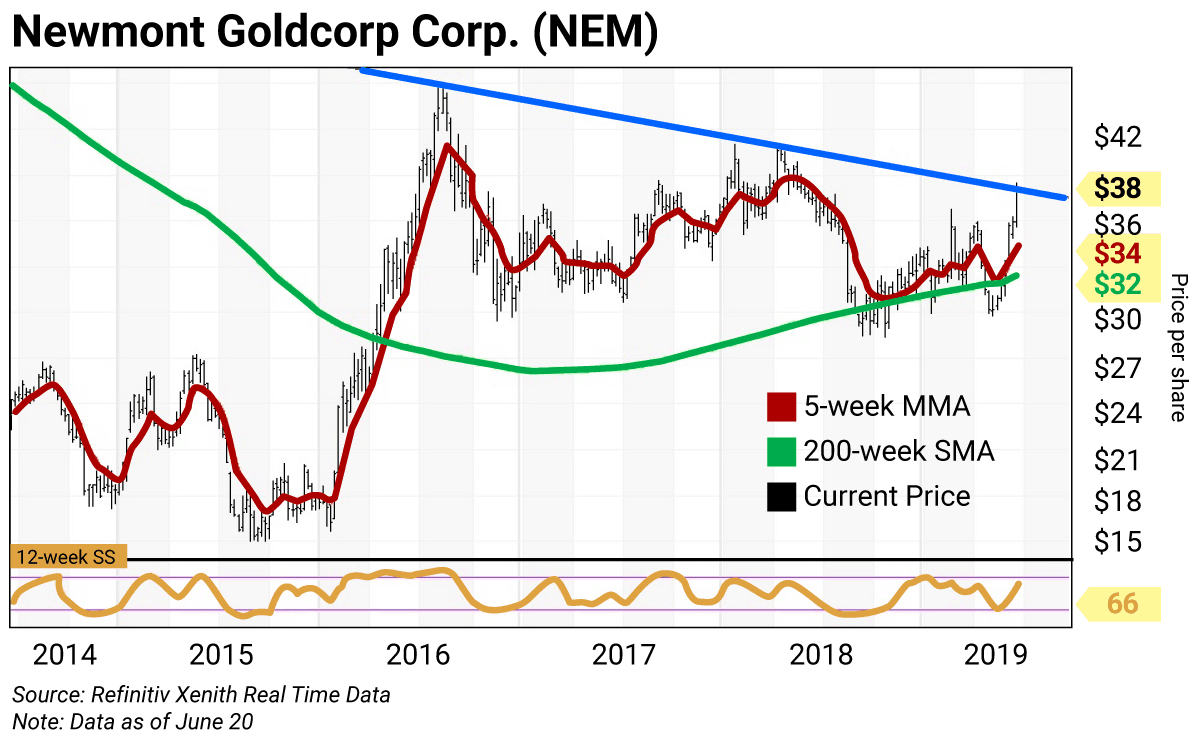
The weekly chart for Newmont is positive with the stock above its 5-week MMA (red line) of $34.43.
Since the week of August 31, 2018, the stock has been climbing its rising 200-week SMA or “reversion to the mean” (green line). Its current $32.38 average is a strong support.
The 12-week SS reading (copper line) is projected to rise to 66.81 this week—up from 52.58 on April 14.
Note the downtrend that connects the $44.05 high the week of August 12, 2016, through the $40.95 high of the week of April 13, 2018. This trend comes in at $38.05 (blue line) and is being tested this week…
I’m not including value, pivot, and risky levels today since the close on June 28 will be the second most important input to my 2019 proprietary analytics (the first was the Dec. 31 close). This close will generate new weekly, monthly, quarterly, and semiannual levels.
Newmont is closely correlated to the price patterns for Comex gold futures. Comex gold futures traded to a five-year high this week, and Newmont Goldcorp should follow. (I avoid recommending futures to most investors—it’s a tricky business.)
The Newmont futures contract reached my June price target at $1,373.20. This level was the monthly risky level for June. Higher targets will be established based upon the stock’s June 28 close.
The fundamentals
Newmont isn’t cheap—its P/E ratio is 27.28 with a 1.56% dividend yield. The gold miner has beaten earnings per share (EPS) estimates for five consecutive quarters.
Trading strategy
A diversified portfolio should have a 10% weighting in gold stocks… and Newmont is my first choice.
Buy Newmont Goldcorp Corp. (NEM) on weakness to its 200-week SMA at $32.37. Keep an eye on the downtrend. A breakout above this line would indicate new highs by the end of the year.
How to read weekly charts
In these pages, we’ll be using both daily and weekly charts to determine the best price levels at which to add to a position on weakness, or reduce holdings on strength, depending on the term of my analysis.
I developed the technical parameters for these charts following the crash of 1987, using rigorous back-testing to come up with a methodology that resulted in the fewest false signals.
Weekly charts typically cover each week over the last five years and are used for longer-term directional calls. For these charts, I came up with a combination that includes a five-week modified moving average (5-week MMA) and a 200-week simple moving average (200-week SMA). These averages show levels of support or resistance as the stock trends higher or lower.
I also use a momentum measure known as the 12-week slow stochastic reading (12-week SS).
A stochastic oscillator is used to generate overbought and oversold trading signals. There’s a fast stochastic reading and a slow stochastic reading (you can read about the differences between these oscillators here). But I found the slow reading works the best.
The stochastic reading scales between 0 and 100. Readings above 80 are considered overbought, and readings below 20 are considered oversold.
Stocks tend to peak and decline 10–20%-plus shortly after a reading rises above 90. I call that an “inflating parabolic bubble,” as a bubble always pops. I also call a reading below 10 “too cheap to ignore.”

 | Rich Suttmeier Founder & CEO, Global Market Consultants |
Editor’s note: Don’t miss this week’s Wall Street Unplugged: Last chance to buy cheap gold. Ivan Bebek of junior minor Auryn Resources shares why he’s bullish on gold and gold stocks going forward.
Ivan’s company is currently up over 21% for All-Star Portfolio subscribers. If you’re not an All-Star Portfolio member, click here to learn how to access behind-the-scenes picks from guests like Ivan and Rich—and many other Wall Street insiders—for a ridiculously low price.