In July, FDIC data showed a positive outlook for four “too big to fail” money center banks. And I showed you the levels in which to add to these positions.
Now, it’s time to book profits…
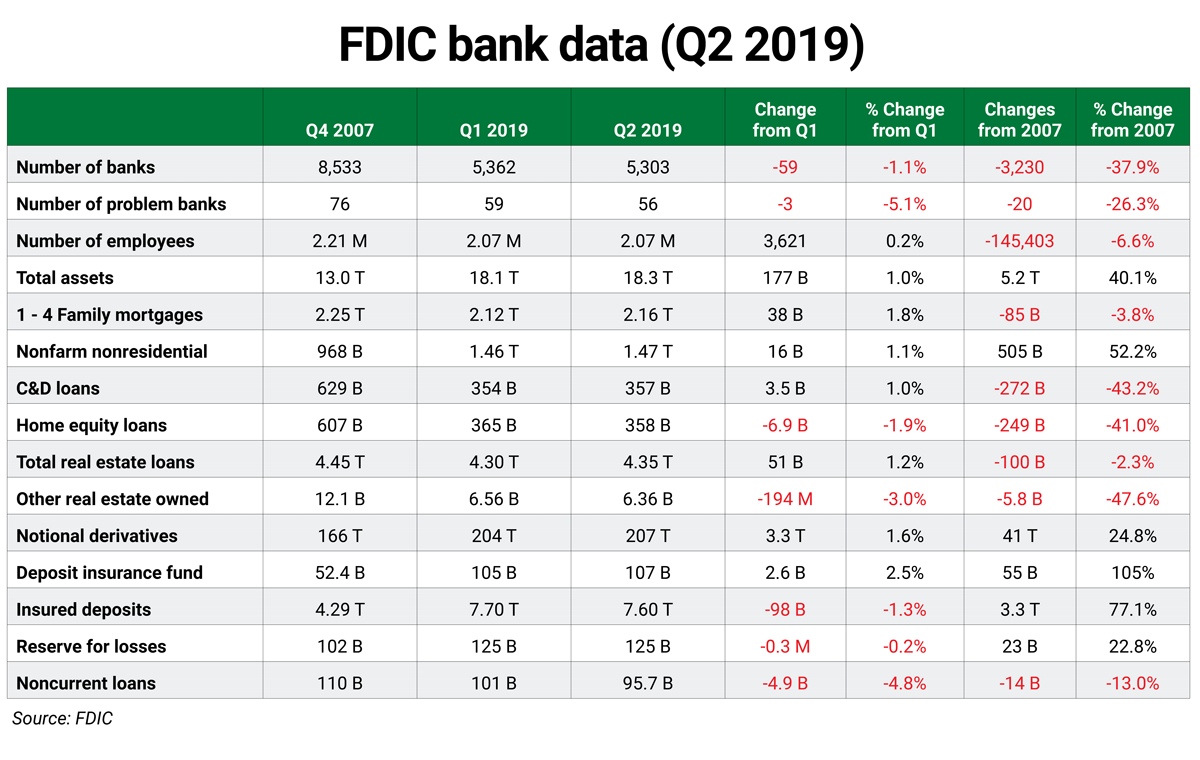
The latest data from the FDIC Quarterly Banking Profile shows steady improvements in the U.S. banking system. Bank profits rose thanks to higher net interest income and continued loan growth.
But there are new concerns for the third quarter (Q3)… The Fed’s rate cut and reversion of the U.S. Treasury yield curve (the spread between the yields on the three-month and 10-year Treasury notes) will put pressure on the big banks.
In sum, banks collect higher interest income on long-term loans and pay lower interest to their depositors. But long-term rates are now barely higher than short-term rates. And that means there’s less room for banks to make a profit on their loans.
Stress on deposits showed up in Q2—insured deposits declined 1.3% to $7.6 trillion. (Deposits decline when savers use their deposits to pay for products and services. One example is to pay down credit card debt.)
The FDIC Quarterly Banking Profile is the balance sheet for the U.S. economy. And as I mentioned in July, it shows the U.S. banking system is shrinking. Since the end of 2007, the number of banks fell 38% to just over 5,300. That means there’s increasing competition among banks for loan customers and depositors. Banking-related jobs are also down, with employment falling 6.6%.
Here’s a scorecard of the key metrics I track:

Residential mortgages (1 to 4 family structures) represent mortgage loans on the books of our nation’s banks. Production rose to $2.2 trillion in Q2, still 4% below 2007 levels.
Nonfarm/nonresidential real estate loans expanded to a record $1.47 trillion, up 52% since 2007. The banking system still faces the risk of loan defaults related to closing retail stores and malls.
Construction & development loans include loans to community developers and homebuilders to finance planned communities. Loan defaults in this category caused more than 500 banks to fail since the end of 2007. C&D loans rose to $357 billion in Q2, down 43% since the end of 2007.
Home equity loans declined nearly 2% in Q2, falling to $358.5 billion. Since 2007, that number is down 41%. This category includes second lien loans to homeowners who borrow against the equity of their homes. Regional banks typically offer HELOCs, but these loans continue to decline quarter over quarter despite the dramatic rise in home prices.
The Deposit Insurance Fund (DIF) represents money set aside to protect insured deposits. All FDIC-insured institutions contribute to this fund annually. The largest banks pay the largest amounts. The Q2 DIF balance reached $107.5 billion, up 105% since the end of 2007. Note that the DIF came in at 1.4% of insured deposits this quarter. The fund already meets the mandated 1.35% threshold, a year ahead of schedule.
The four biggest banks control more than 40% of the assets in the banking system and are assessed much more than the smaller banks.
You can see in the table below that these stocks are just off their highs, or nearing tests of their risky levels.

Trading strategy
Reduce holdings on Bank of America (BAC), Citigroup (C), JPMorgan Chase (JPM), and Wells Fargo (WFC) on strength to their risky levels provided below.
For details on using trading levels, see the box below.
Bank of America (BAC)
- Value (annual): $24.07
- Risky (semiannual): $31.16
- Risky (quarterly): $31.90
- Risky (monthly): $32.48
Citigroup (C)
- Value (annual): $55.32
- Pivot (semiannual): $67.83
- Pivot (quarterly): $68.15
- Risky (monthly): $79.81
JPMorgan Chase (JPC)
- Value (annual): $102.64
- Risky (semiannual): $118.31
- isky (quarterly): $120.14
- Risky (monthly): $119.85
Wells Fargo (WFC)
- Risky (annual): $63.29
- Pivot (semiannual): $47.99
- Pivot (quarterly): $47.98
- Risky (monthly): $49.20
How to use trading levels
Value, pivot, and risky levels on a chart pinpoint strategic buy and sell levels. They’re a great tool for maximizing gains and limiting losses on stocks you plan to hold long-term.
Risky level: sits above where the stock is trading
Pivot level: often sits right around where the stock is trading. A pivot level is a value level or risky level that was violated within its time horizon. Pivots act as magnets and have a high probability of being tested again before the time horizon expires.
Value level: sits below where the stock is trading
The general idea is to buy around a value level line and reduce holdings around the risky level line. You can rebuild your position on weakness.

 | Rich Suttmeier Founder & CEO, Global Market Consultants |
Editor’s note: On Monday, Rich predicted new highs for the markets… and an opportunity for investors to raise cash. Read his full analysis on Forbes here: The Dow, S&P 500 and Nasdaq Are Poised For New Highs, Then Bust.


