Just yesterday, I heard a financial news commentator say this market “is the most hated rally ever.”
The stock market is frustrating right now—especially if you’re on the sidelines watching prices race higher every day. One day, it’s new highs, then the next day, another downturn. Then it’s right back to higher highs the day after that.
Investors want to ride these highs, but they also don’t want to tank their portfolios with overbought stocks… and with hindsight, those “I should’ve bought or sold” moments can feel even more painful.
For “Mom and Pop” retail investors—folks like you and me—few things are worse than the fear of missing out (FOMO). It often causes investors to jump into the market for the wrong reasons, and at the worst possible times.
But I believe today’s market is rising on more than just FOMO. Enthusiasm is creeping in and propelling things higher… and as good as that sounds, it could be a bad sign.
When I analyze the market for trends or potential investments, I look at the cold, hard data.
I have software that allows me to monitor thousands of stocks and exchange-traded funds (ETFs) each day to get a clear picture of the stock market. Focusing on ETFs not only gives me insight into the trading habits of the average investor… it can also be an indicator of impending market events. Here’s why…
If you’re not familiar, ETFs are essentially a basket of stocks packaged into a single investment that’s priced and traded like a stock. If one particular investment in the ETF basket goes bad, the loss is mitigated by the other positions.
It’s what makes ETFs so appealing to Mom and Pop investors: The ability to invest in names like Facebook or Amazon at a fraction of the cost, and (usually) with less risk than just owning the stock outright.
Last week, we believe we saw these retail investors really start piling into stocks. This often happens after a big rally, because it feels safe to get back in the market. But this time was different…
For much of this rally, the market data has been missing a key factor: everyday investors scooping up ETFs.
For me, it’s the ultimate “Mom and Pop” indicator, because big ETF activity can mean inexperienced hands are entering the stock market… that the general market outlook is so rosy, the average novice investor is diving in head first.
When overbuying becomes this intense, it often foreshadows a near-term shift in the market.
ETF buying is accelerating
At my research company, Mapsignals, we focus on measuring “Big Money” activity—the buying and selling activity of pension funds, hedge funds, and other large professional institutions.
After years of handling Big Money trades on Wall Street, we realized that these under-the-radar Big Money trades are often what drive the market. And we made it our goal to uncover the Big Money moves and offer insights not found anywhere else.
So when ETF data like this jumps out at us, we bolt to attention. It’s like if your normal morning commute were interrupted by a speeding Mardi Gras float blasting When the Saints Go Marching In—it’s hard to miss.
And just like that speeding Mardi Gras float, this market indicator leaves investors with two options… Invest and keep moving, or sell and get out of the way.
Below is a chart of the Mapsignals Big Money ETF Index vs. the S&P 500, going back to January 2018.
The Big Money ETF Index is similar to our Big Money Index, but instead of tracking Big Money moving in and out of stocks, it tracks ETFs being bought or sold in huge volumes. The green bars show the total ETF buys in a given day, while the red bars show sells. The circles are large ETF buying periods (the most recent circle being last week).
By plotting these signals with the S&P 500, you can see how large moves in ETFs often foreshadow a shift in the market. A lot of green can indicate a peak and that a pullback is near, while big red sticks can indicate near-term market lows.
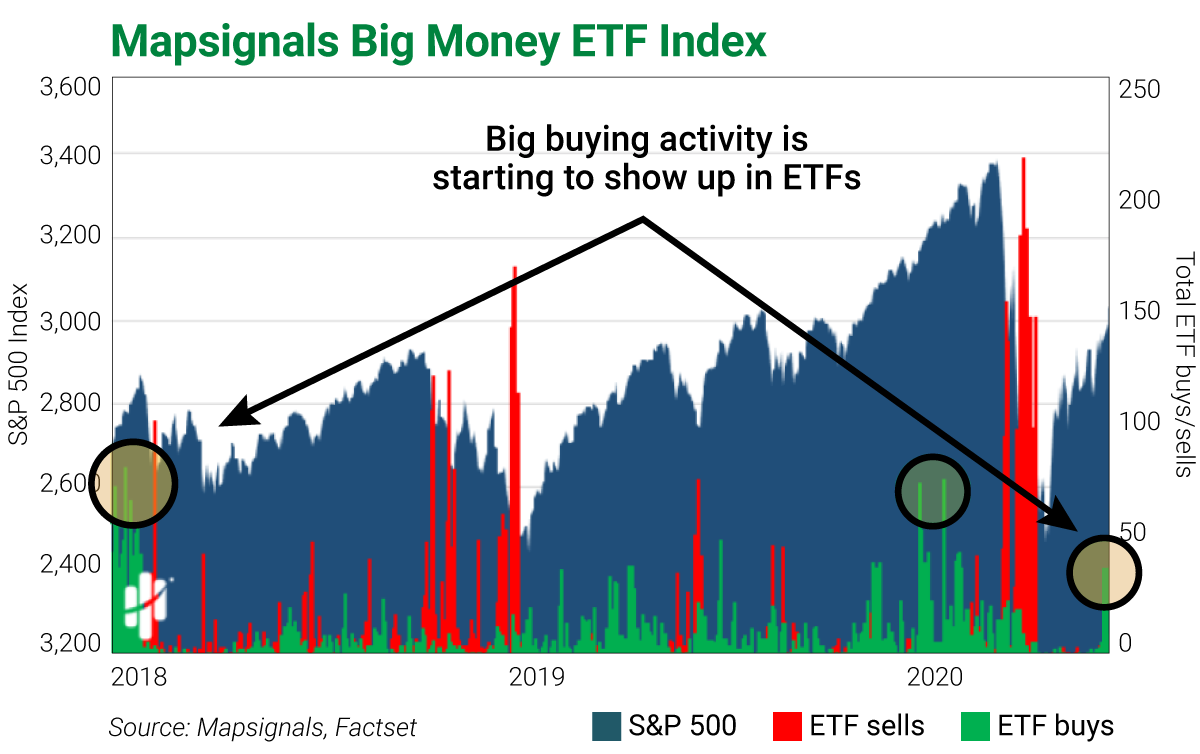
There are two important takeaways from this chart:
- The recent big ETF buying (green bars) just started. Typically, once it starts, it lasts for many days. You’ll normally see a cluster of green, meaning the market could grind higher for a few more weeks.
- We have seen much bigger ETF buying days before last week (circled above). So while ETF activity is ramping up right now, it isn’t extreme—yet. When buying becomes extreme, a market peak could be around the corner.
Before last week, the last two extreme ETF buy times were in January 2018 and January 2020. Both preceded a drop in the market.
When ETF buying explodes, be careful
Following the Big Money is a lot like watching the flow of traffic. Every now and then, something makes you take a second look (like a speeding Mardi Gras float). The cool thing is we can rewind to similar points in market history to get an idea of how things might play out.
Markets have been overbought for weeks now, which is normal after a crash like we saw in March. But the last stage of an overbought market usually involves an explosion in ETF buying by retail investors. Mom and Pop see the market hitting new highs and pour their money into ETFs to try and chase a wave they’ll likely never catch.
Right now, that moment looks to be on the horizon… but it’s likely weeks away. ETF buying just started, but when it gets extreme—watch out!
Until then, I’m going to enjoy the most hated rally ever.
Editor’s note: ETFs are a great way to increase your exposure to a name or sector with less risk… but as Luke highlights, you still need to know what and when to buy.
The Dollar Stock Club members receive a fully vetted stock pick every week—including ETFs—from Frank’s Rolodex of insiders.
At $1 per stock pick, this club is an incredible way to access investment ideas you won’t hear about anywhere else…