I’m seeing a lot of valuation arguments raging right now…
It’s understandable.
The market is at an all-time high, in spite of the worsening pandemic.
So it’s no surprise many investors are saying the market is too expensive. They’re cautious… and think others should be too.
Others argue the market is priced just right… and some say stocks are undervalued, especially considering the outlook for massive fiscal spending and the zero-rate environment.
Yes, equity investors have a reason to be bullish… but this reason has little to do with stocks. The bond market is arguably the biggest catalyst for stocks.
You see, Treasury yields are stuck near record lows. That means investors can’t make a decent return by owning bonds. This situation creates a huge boost for the stock market. Put simply, stocks are the only game in town for making money long-term.
But shorter-term, I’m firmly in the first camp.
The market is just too expensive right now… based on historical metrics.
Today, I’ll show you why. We’ll take a look at how valuations work… and discuss two popular investing metrics that have already moved into an uncharted territory.
Let’s start by looking at the P/E (price-to-earnings) ratio.
The P/E metric is the most popular measure of relative value for stocks, whether you’re looking at a company, a sector, or the entire market. There’s a good reason for its popularity… The ratio focuses on the fundamental reason an investor wants to own a company: its profits.
If you’re an investor in a public company, you become its co-owner. And as a co-owner, you want to know whether or not the business is making money… and how much it will make in the future. You invest in order to claim a portion of its cash flow, profits, and dividends.
The P/E metric tells us how much investors are currently paying for a unit of profits. For example, if a stock trades at $18 while the company makes $1 a year in per-share earnings, you’re paying 18 times (18x) earnings for the stock.
The P/E ratio, also known as the P/E multiple, can use historical earnings or future earnings (based on estimates). For example, a trailing P/E uses last year’s earnings, while a forward P/E takes into account next 12 months’ estimated profits.
Growing companies typically trade at a higher P/E, while stagnating companies usually have a lower metric. A lower P/E means a stock is cheaper… but it typically means investors have lower expectations for future earnings.
As an example, let’s take a close look at Apple (AAPL), the largest company in the S&P 500.
Next year, AAPL is expected to make $3.95 per share in profits. With the stock trading around $117 per share, this means that Apple demands around 30 times (30x) forward earnings.
Whether a P/E of 30x is too high or too low depends on how Apple does in the future.
If Apple stops growing (if annual earnings stay at $3.95 per share, indefinitely)… it would take 30 years (until 2050) for AAPL to earn today’s share price in cumulative earnings.
But Apple is growing. Investors expect the company to grow earnings by 11% next year. And if it continues growing earnings by 11% every year, AAPL will earn its share price (cumulatively) in about half that time—just 14 years. In other words, Apple would earn its current price by 2034, instead of 2050. If its growth accelerates, so will this “payback” period… and the current value will look more attractive.
This is why growing companies are worth more than stagnating ones… years of growth can send earnings skyrocketing.
But some companies—especially younger ones—are not profitable. That means their earnings are zero or negative… which makes their P/E ratio meaningless.
While they may not have profits yet, early-stage companies are usually growing their revenue (sales) at a high rate.
This is when another metric—the price-to-sales (P/S) ratio—is especially useful.
As the name implies, the P/S ratio (or multiple) gives us an idea of how expensive a stock is based on a company’s annual revenue.
The P/S multiple works similar to the P/E multiple. If a company is growing fast, the market assigns a higher P/S multiple to its shares. A slow-growth company will almost always have a lower P/S ratio.
It’s a useful metric for two reasons…
First, the P/S ratio uses annual revenue—a financial metric that’s easy to understand and difficult to manipulate. And secondly, the P/S valuation can be applied to any business, of any size, and at any stage of its lifecycle.
Whether or not a certain P/S is considered high (or low) will depend on the company’s future growth… and also on its profit margins (or just how much of the revenue the company gets to keep as profit). That’s why a high-margin company will typically have a higher P/S ratio than a low-margin business.
Just like with P/E ratios, a higher P/S ratio means a stock is more expensive. The higher the P/S… the riskier the investment.
Let’s look at Apple again.
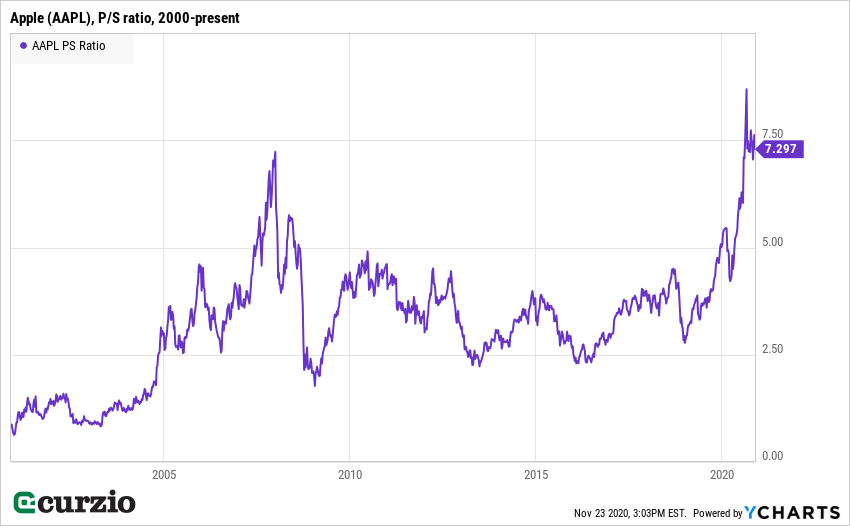
If you look at the above chart, you can see that AAPL sells at the highest P/S multiple in 20 years. Based on price-to-sales, shares of Apple are more expensive than they were at their previous high (in December 2007).
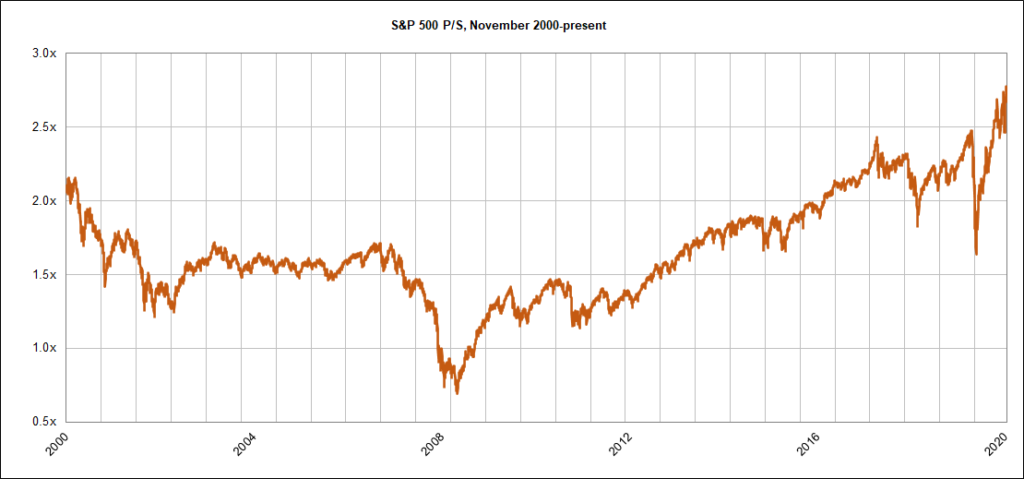
It’s not just Apple…
The entire stock market trades at a historically high P/S level. The chart below includes 20 years of data for the S&P 500. As you can see, the market currently trades at 2.7x sales. That’s 60% more expensive than it was in 2007, just before the worst bear market of our time.
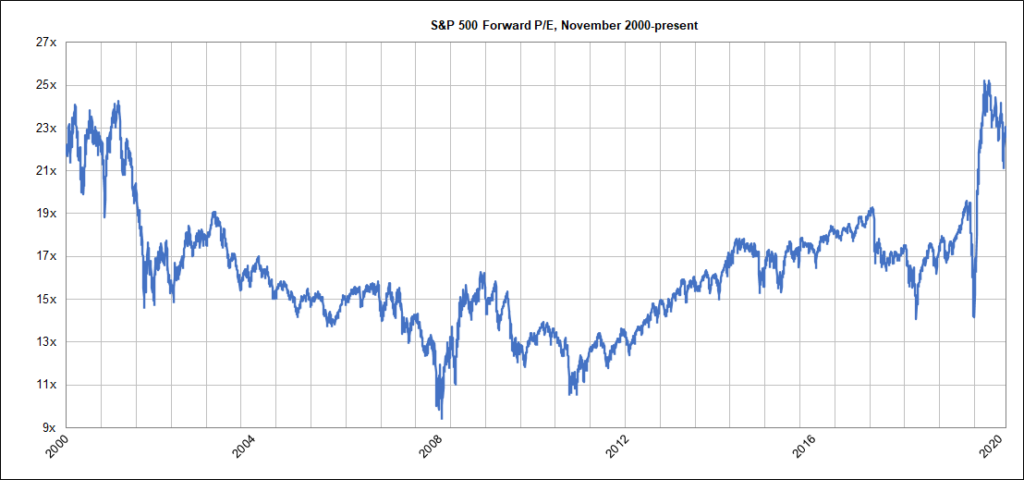
The P/E ratio tells us a similar story. The market-wide rally this year sent the S&P 500’s P/E ratio up to 25x. As you can see below, the P/E has come down a bit (because of the improving expectations), but it’s still far above typical levels from the past 20 years…
The market is climbing a “wall of worry,” you might say.
There’s a good reason for the markets to climb higher. Investors anticipate a sharp improvement in future revenue and profits.
However, at today’s valuation levels, the market has largely scaled the 2020 wall of worry. Investors have already priced in a very sharp increase in earnings growth over the next year.
There’s a simple takeaway when we look at these historically high P/E and P/S valuations…
This market is treacherous.
If the growth scenario doesn’t materialize, the market’s current levels might prove to be the top…
That’s why maximum caution is required.
2021 is shaping up to be a stock-picker’s market… but the major indices—as well as the most overpriced stocks—are destined for much harder times.
The market is pricing-in a lot of positives already; including the highly effective vaccine, the continuing Fed support, and very high amounts of stimulus spending. In other words, investors are pricing-in a best-case scenario.
So be vigilant: Stay selective in your long-term buying… consider taking some gains off the table… and watch fiscal and monetary policy trends for signs of trouble.
A policy mistake—such as an early withdrawal of emergency lending programs, or a premature rate hike—can send this market down quickly.
Editor’s note: Genia’s Moneyflow Trader is the No. 1 service Frank recommends for times of uncertainty and risk.
Genia uses a conservative options strategy that can quickly capitalize on big moves in your favor… but also keeps you insulated when a position moves against you.
You can see truly massive returns… while risking very little capital. And with our Black Friday Mega Sale, you can get Moneyflow Trader for an incredible 60% off.
The deal starts tonight at midnight. So keep an eye on your inbox…