Buy Exxon Mobil (XOM) below $71.98. The stock is trading at $69 today, so you should have no problem buying this name below this level.
Exxon Mobil (XOM) is the biggest oil company in America, with a $300 billion market cap and operations on almost every continent.
Right now, Exxon is one of the cheapest stocks—paying one of the highest yields (5.1%)—in the Dow Jones index.
Nymex crude oil futures is showing a positive weekly chart and is above its 200-week simple moving average (SMA)… which is positive for Exxon.
My system is telling me the bottom is in. And we have an opportunity to capture more than 17% gains on Exxon over the next few months…
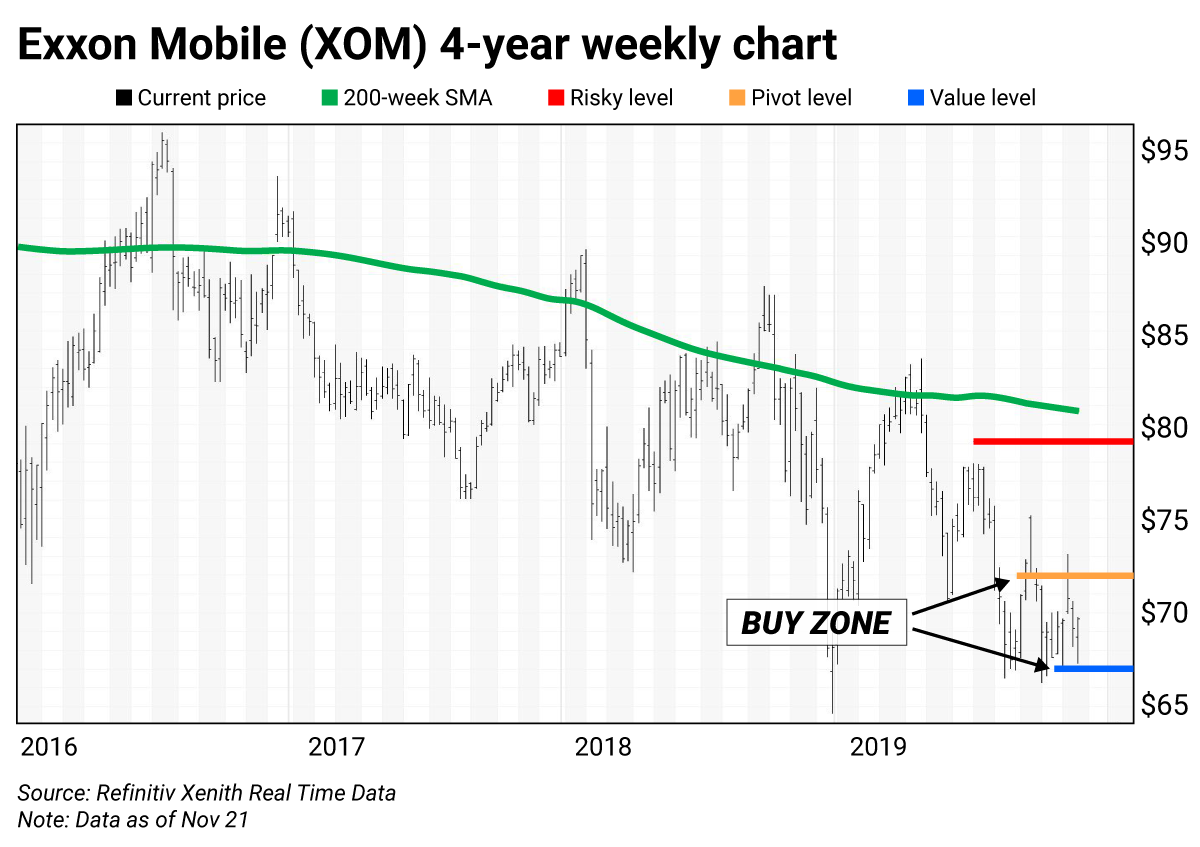
In this chart, you’ll see Exxon has been in a downtrend for close to four years (since July 2016). Over this time, the stock has been volatile, hitting lower lows. This volatility can act like a road map, helping us to predict Exxon’s future price action.
For example, the 200-week SMA (green line) is a key level. As you can see, it’s been tested numerous times on strength over the past four years. But the stock hasn’t been able to hold above its 200-week SMA for long.
Why we are buying today?
XOM’s price is super depressed right now. It’s trading at $69 a share, close to my monthly value level of $66.98 (the extreme value level of the stock). But I expect the pattern to continue… and for XOM to retest the $80.74 level in the short term.
If I’m right, that would give us a quick 17%-plus return on this name. But if the stock takes a little longer to trade back to its 200-week SMA… that wouldn’t be the worst thing, as we can sit back and collect XOM’s huge 5%-plus dividend.
Action to take: Buy Exxon (XOM) below $71.98. This is my quarterly pivot level (the highest price we want to pay for the stock). My price target is between $79.12 (the semiannual risky level) and $80.74 (the 200-week SMA). When the time comes, this is where we want to take profits.
How to use trading levels
The trading levels on my charts pinpoint strategic buy and sell levels. They’re a great tool for maximizing gains and limiting losses on stocks you plan to hold long-term.
Value levels and risky levels are based upon the last nine monthly, quarterly, semiannual and annual closes. The first set of levels was based upon the market closes on December 31. The original annual level remains in play.
Value level: Sits below where the stock is trading.
Pivot level: Often sits right around where the stock is trading. A pivot level is a value level or risky level that was violated within its time horizon. Pivots act as magnets and have a high probability of being tested again before the time horizon expires.
Risky level: Sits above where the stock is trading.
To capture share price volatility, investors should buy on weakness to a value level and reduce holdings on strength to a risky level.

 | Rich Suttmeier Founder & CEO, Global Market Consultants |
P.S. To uncover these trades, Rich uses a system Black Box trading system of “proprietary analytics” he engineered over 30 years.
Using this Black Box, Rich has predicted virtually every major market move with stunning accuracy.
In just the past 11 months, Rich closed out 25 winning trades for an average annualized gain of nearly 600%.
We designed a brand new trading service centered around Rich’s Black Box called 2-Second Trader.
Sign up to be the first to hear more about this new service, here.