
All my friends are asking the same question right now: “When will the stock market hit bottom?”
Everyone wants to buy the dip. Most of my friends understand that stocks are the best way to generate long-term wealth over time.
But everyone is scared. Stocks keep sinking. After falling more than 8% over the past month, the S&P 500 is down about 16% since the start of 2022.
These kinds of downtrends are terrifying. But stock market history is full of big pullbacks. And we can use this history—plus my Big Money data—to figure out when to start buying BIG… with both fists…
Let’s get into it…
The latest Big Money data shows big selling
This shouldn’t surprise anyone: The level of recent selling is epic… And the Big Money data shows few buyers, which is sending stock prices down hard.
Just last week, my data showed the most selling in stocks and ETFs in over a year.
Below, you can see a chart of the total buys and sells in the stock market each day. The vertical red bars are the number of stocks getting sold… while light blue bars show how many stocks saw strong buying on a given day.
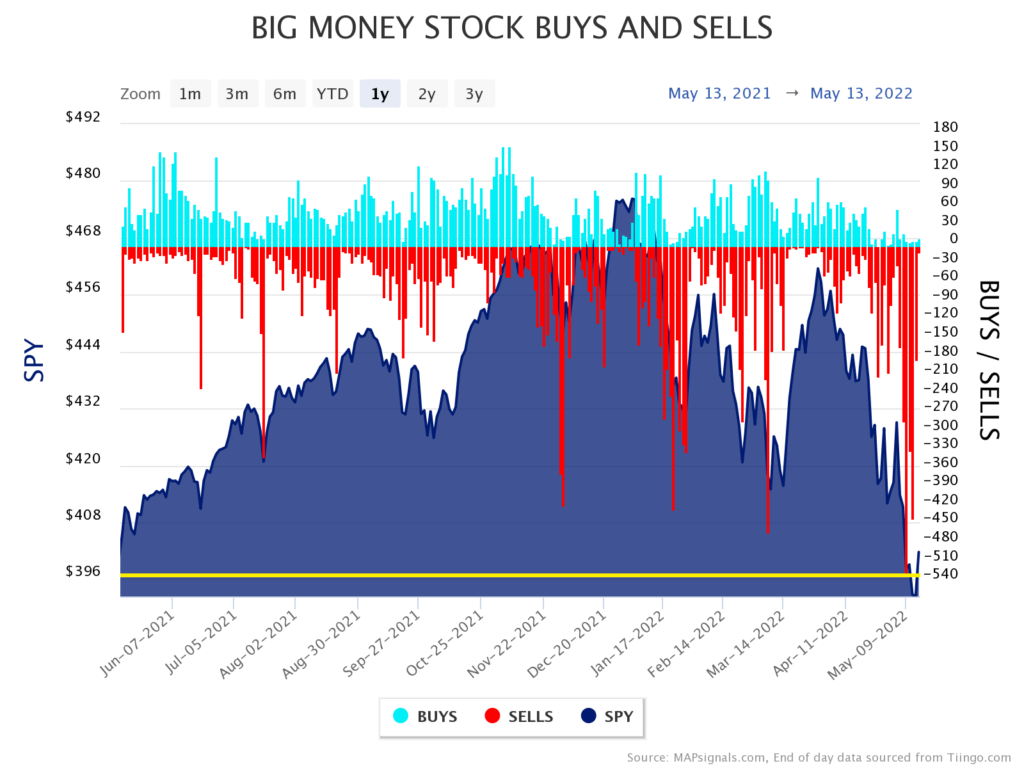
Notice the massive amount of red bars on the right side of the chart… and how the buying (light blue bars) has nearly disappeared over the past month. That’s the simplest reason we’re in a relentless selloff.
At the bottom of the chart, I’ve added a horizontal yellow line. It lines up with last week’s selling, which surged to 540. In other words, 540 different stocks declined on big selling volume… that’s the most selling since the pandemic broke out in March 2020.
Now let’s run the numbers for exchange-traded funds (ETFs) to see if there’s any difference:
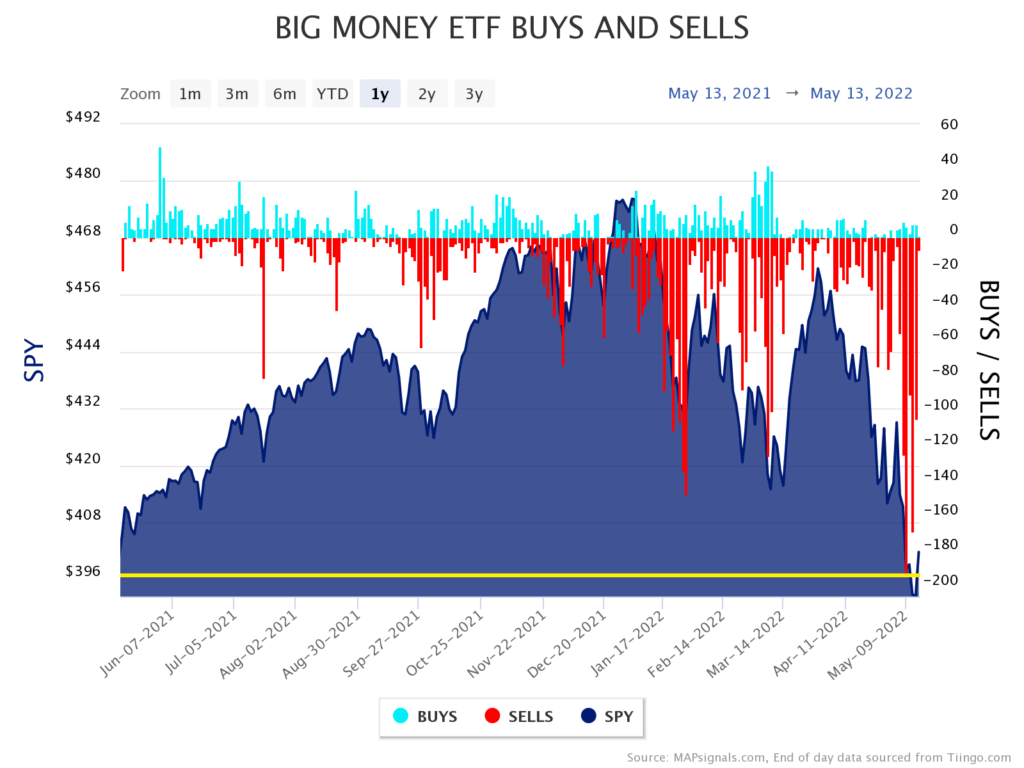
Nope. This chart shows the same thing: Nearly 200 ETFs generated sell signals last week. Just like the previous chart showed us, it’s the biggest selling in over a year.
But there’s a silver lining to this ugly data…
When there’s this much selling in the stock market, we eventually reach oversold levels. In other words, institutions eventually sell enough to account for all the uncertainties they’re worried about. (As you probably know, right now, inventors are worried about rising interest rates, soaring inflation, and how much the economy will slow down during the second half of 2022.)
If you look at the historical data, you’ll see that markets end up making a big bounce after enough selling happens… which leads to huge gains over the next year (and beyond).
That leads to our next question: How much selling is enough?
Oversold = the green light to start buying
My favorite indicator is the Big Money Index (BMI). It’s a 25-day moving average of the daily buys and sells in over 1,000 stocks. In order to generate a buy/sell signal, a stock needs to show big trading volume, which tells us Big Money investors are responsible for the action. If the stock jumps higher on big volume, it’s a buy signal. And if it declines on big volume, we know investors were selling.
Put simply, the BMI tells us what percentage of these signals are buys.
As you can guess, the BMI has been nosediving, which makes sense considering the major selloff in markets.
After looking through decades of historical data, the “oversold” mark for the market is around 25%. In other words, when only 25% of all the signals are buys… that’s a historic amount of selling. To put this into perspective, the BMI has hit the oversold level 20 times over the past 32 years. So, this level of selling happens about every 1.6 years on average.
Below, you can see the two-year BMI chart. The BMI is the light blue line. The dark blue background shows the performance for the S&P 500, represented by the SPDR S&P 500 ETF Trust (SPY):
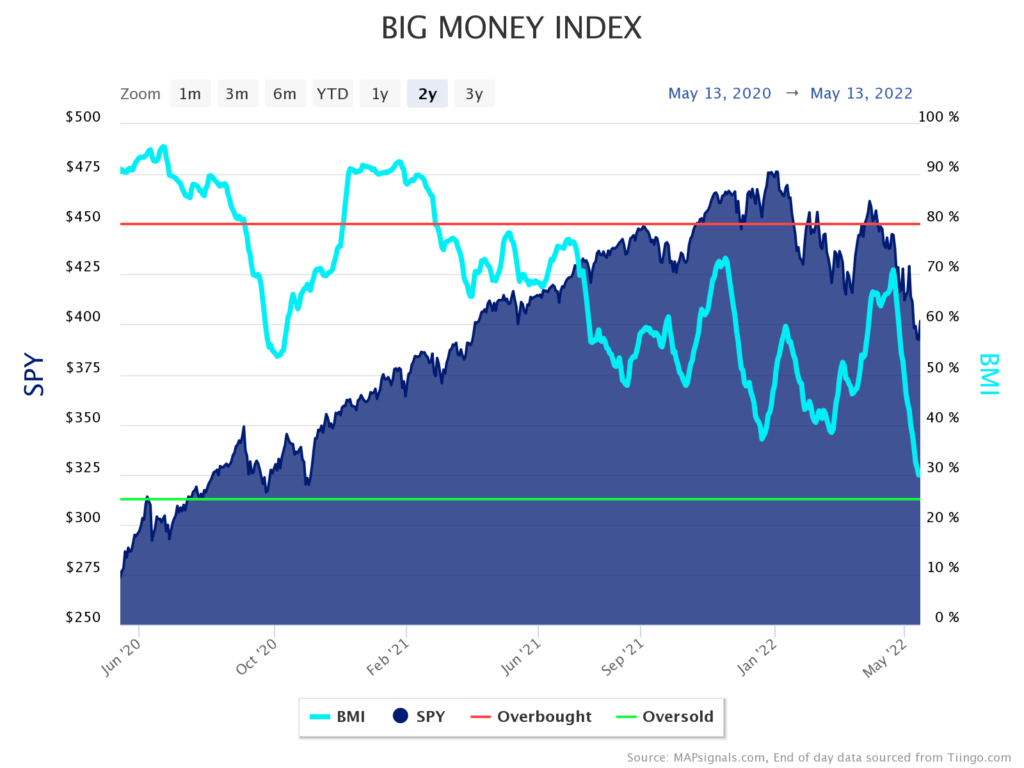
As you can see on the right side of the chart, the BMI is right at 30%. It’s quickly approaching the green horizontal line, which represents the critical 25% oversold level.
To hit oversold levels, it means there’s 75% sellers vs. 25% buyers over the past five weeks. We’re not at 25% yet… but we’re inching ever so close to the green zone and could hit it as soon as next week.
The oversold line is a critical level to watch—when the BMI crosses it, it indicates markets have been sold too much. And as I’ll show you below, history tells us it’s a great time to start buying with both fists…
Investors make huge gains when this signal triggers
Let’s take a look at the last three times the BMI hit the 25% oversold level.
To keep things simple, we’ll focus on the S&P 500 (represented by SPY).
As I mentioned earlier, the last time we hit 25% was during the pandemic-related crash in March/April 2020…
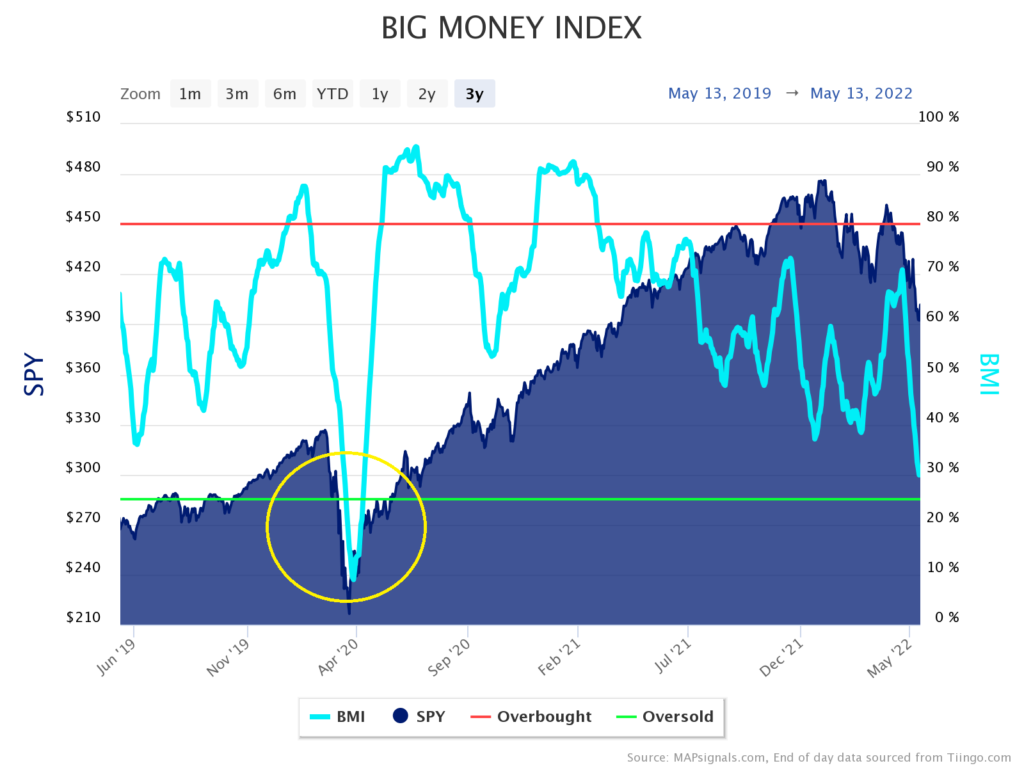
The yellow circle shows how ugly things got during the pandemic crash. Notice that the BMI plunged well below the 25% oversold line (it bottomed below 10% in April 2020).
While the action was brutal, the incredible amount of selling helped start a monster uptrend. The BMI broke below 25% on March 18, 2020. It wasn’t the exact market bottom, but it was pretty close (less than a week).
Most importantly, if you’d bought SPY the day the BMI hit oversold… you’d have set yourself up for massive gains. Exactly one year later, the S&P 500 was up 50%. And if you’d held for two years, you’d be sitting on a 64% gain.
But one example isn’t enough, so let’s keep going…
The next most recent instance of the BMI hitting oversold happened in late 2018. You can see the BMI break through the green line right in the middle of the chart below…
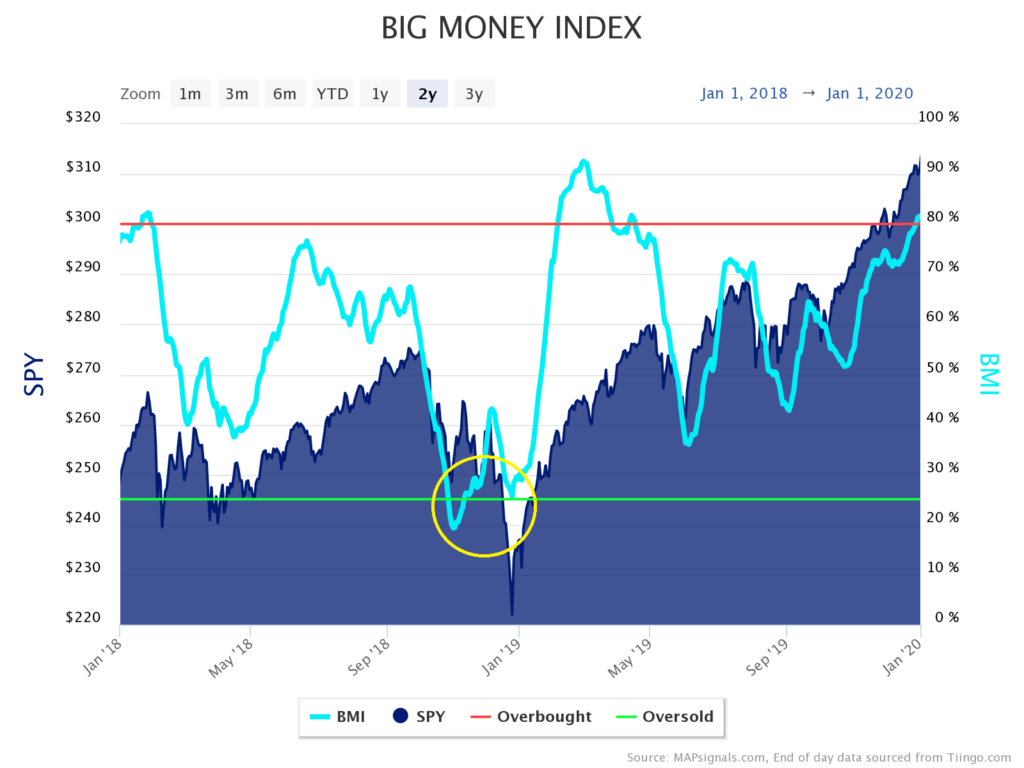
As you can see, the oversold signal triggered on October 26, 2018. In this case, the signal was early: The S&P 500 didn’t bottom until two months later (in late December).
Like today, investors were worried about rising interest rates and a slowdown in the economy.
But if you’d bought as the BMI triggered an oversold signal… you’d have set yourself up for solid gains over the next 12–24 months. One year after the signal, the S&P 500 had gained 9.6%. And if you’d held SPY for two years, you’d have ended up with a 24.7% gain.
This example shows that you don’t have to catch the bottom perfectly. Even though the S&P kept falling for two months, you would have still made big gains over the next year-plus.
For good measure, let’s go even further back in history. Prior to 2018, the last time the BMI hit 25% was in February 2016. Here’s what the S&P 500 chart looked like back then:
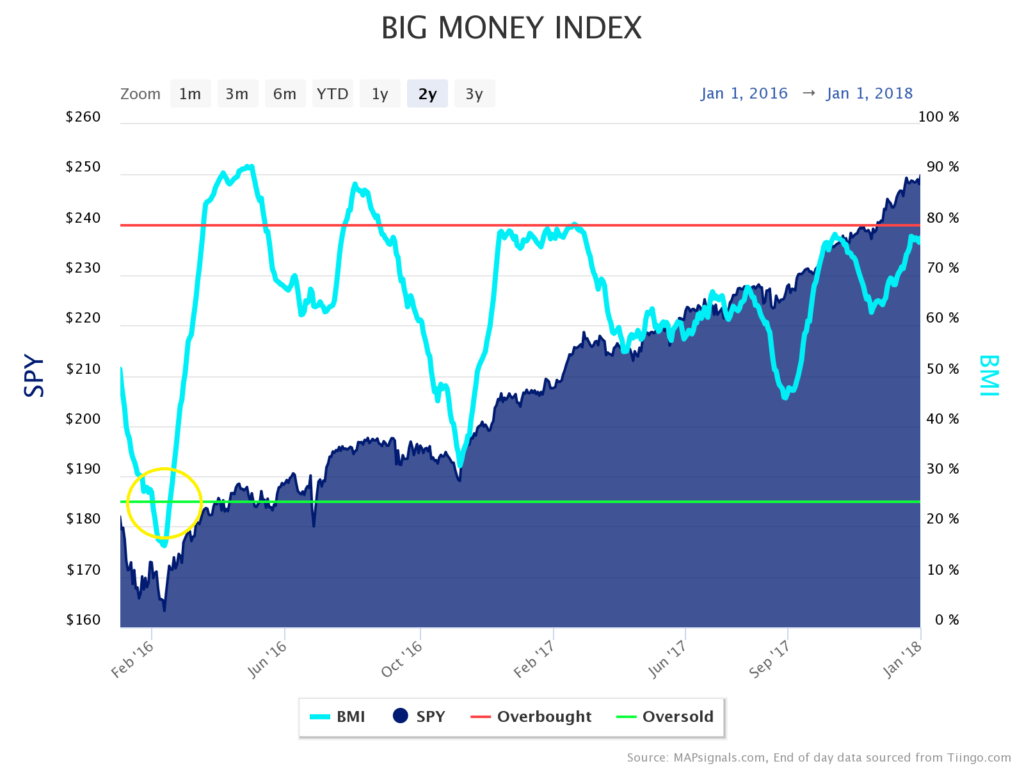
In this example, the oversold signal happens on the left side of the chart. As you can see, the BMI sliced through the green line on February 2, 2016.
We don’t need to cover the specific fears that made investors sell in early 2016. The only thing that matters is that the level of selling was unsustainable. Once the BMI hit oversold, enough selling had already been done… which set the stage for a massive rally over the next two years.
One year after the BMI hit oversold, the S&P 500 was up 23.8%. And two years later, it was up 44.1%.
The biggest takeaway from these three examples is this: Watch the level of selling in the market.
By the time all the uncertainties—like inflation, interest rates, and an economic slowdown—have been resolved, the stock market will have already bottomed… likely many months beforehand.
The smarter strategy is to buy once there’s enough selling. It’s not an easy thing to do… but the BMI gives us a simple way to determine whether stocks have finally hit oversold levels.
As the above examples illustrate, investors who bought the market as the BMI fell to 25% ended up generating big gains over the next 12- and 24-month periods. The average one-year return for our three examples is 16.7%… and the average two-year gain is a whopping 34.4%!
I’ll be watching the BMI closely over the next week and beyond. As I mentioned above, we haven’t hit oversold yet… but it’s likely to happen within a couple of weeks, if not sooner.
Investing during a bear market is tough. It’s painful to watch stock prices sink. Plenty of my personal holdings are down big year-to-date. But these selloffs happen every few years.
The best way to take emotions out of the process is by looking at the indicators… and buying with both fists when you get the green light.
P.S. If you wish you’d bought stocks at pandemic lows… you have another chance now.
As money rushes out of the market, it’s creating incredible opportunities to buy the best stocks… at historic discounts.
Sign up for The Big Money Report today to find out what I’m buying during the current pullback.