
Five years ago, oil giant Schlumberger was riding high…
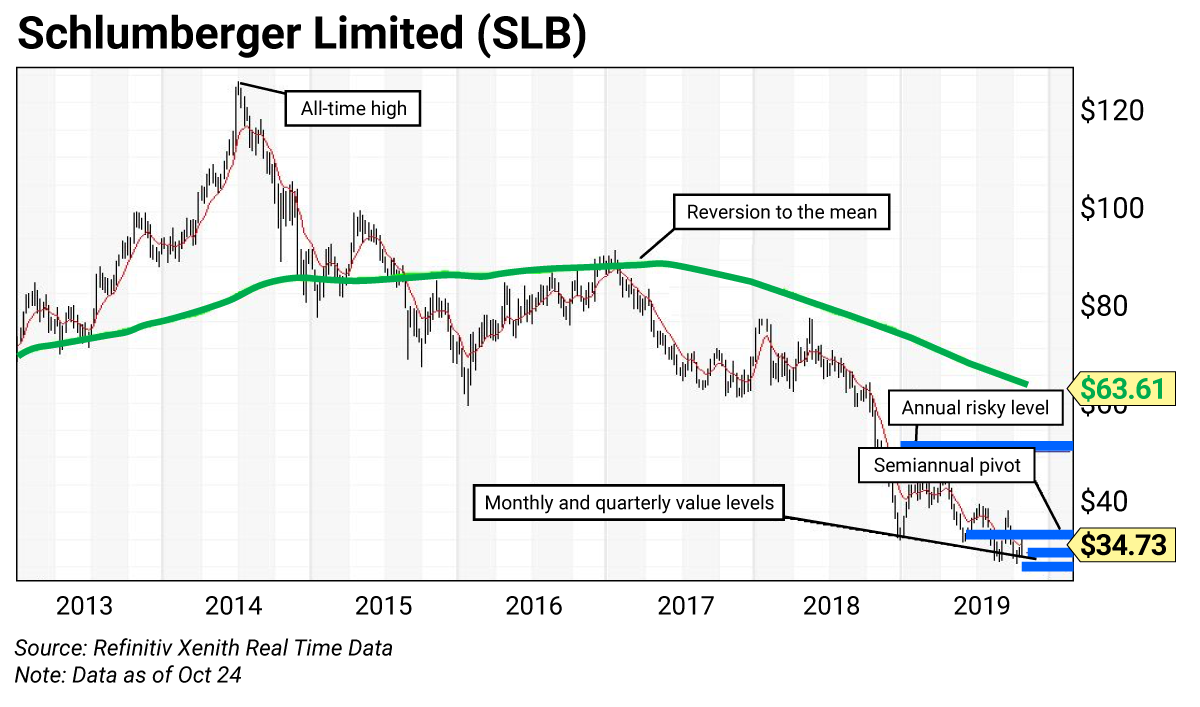
During July 2014—with oil prices sitting well above $100 a barrel—shares of the company were trading as high as $118.70. But in recent years, plunging oil prices and a slowdown in U.S. drilling activity have knocked the stock into a tailspin.
However…
Today, conflicts in the Middle East continue to weigh on oil production in the region.
This should lead to an increase in U.S. oil production over the next year or more. The world needs crude oil… and Schlumberger’s drilling services have the potential to help the U.S. become the world’s largest oil supplier.
Oil giant Schlumberger Limited is the world’s largest oilfield services company. It operates in 85 countries and is a proxy for worldwide demand for crude oil.
As you can see in this week’s chart, Schlumberger traded back and forth around its “reversion to the mean” levels (its 200-week simple moving average) from late 2014 to early 2017.
After the average failed to hold, the stock fell into a brutal downtrend. But it wasn’t bad press or missed targets that caused the stock to plunge…
Oil prices were the main culprit. Crude oil fell to a low of $26.05 during February 2016.
Since then, crude oil prices have rebounded sharply. They’re currently sitting around $56—up more than 115% from their February 2016 lows.
Despite this surge in oil prices, shares of Schlumberger haven’t benefitted… yet.
Today, the stock is trading between its quarterly value level at $29.88 and its semiannual pivot at $35.77. I consider this area a “must-buy” price zone.
Remember, the stock has been trading below its 200-week moving average for nearly three years. That puts it in clear value territory, especially relative to oil prices.
Finally, I need to mention Schlumberger’s solid fundamentals. Shares are trading at a reasonable P/E ratio—less than 20 times (20x) forward earnings estimates. Even better, investors get to collect a dividend yield of 5.7%. That’s a hefty payment while we wait for our “reversion to the mean” trade to play out.
Schlumberger trading levels
- Risky (annual): $51.15
- Pivot (semiannual): $35.77
- Pivot (monthly): $32.54
- Value (quarterly): $29.99
Trading strategy
Buy Schlumberger for its solid fundamentals, its value relative to oil prices, and its hefty dividend.
Today, Schlumberger shares are sitting between their quarterly value level at $29.88 and their semiannual pivot at $35.77. These key levels create a “must-buy” value area for investors.
The 200-week moving average—currently at $63.61—creates an upside target for our “reversion to the mean” trade. With Schlumberger sitting below $35 a share, our potential gain is more than 83%.
How to use trading levels
The trading levels on my charts pinpoint strategic buy and sell levels. They’re a great tool for maximizing gains and limiting losses on stocks you plan to hold long-term.
Value levels and risky levels are based upon the last nine monthly, quarterly, semiannual and annual closes. The first set of levels was based upon the market closes on December 31. The original annual level remains in play.
Value level: Sits below where the stock is trading.
Pivot level: Often sits right around where the stock is trading. A pivot level is a value level or risky level that was violated within its time horizon. Pivots act as magnets and have a high probability of being tested again before the time horizon expires.
Risky level: Sits above where the stock is trading.
To capture share price volatility, investors should buy on weakness to a value level and reduce holdings on strength to a risky level.

 | Rich Suttmeier Founder & CEO, Global Market Consultants |