Facebook (FB) will testify at a U.S. government hearing on Monday along with other technology companies concerning the French Senate (Sénat) decision to levy a 3% tax on revenue generated from digital services.
The U.S. Trade Representative Office calls this new tax unreasonable. The trade office could issue new tariffs on French goods or other trade restrictions after the public comment period ends on August 26.
This is just one cloud that currently hangs above the F-member of the FAANG family of stocks. Today, I’ll briefly cover the social media giant’s latest list of problems and how it’s affected earnings.
As you’ll see from the daily and weekly charts, it’s time to take some Facebook stock off the table…
On July 23, the U.S. Department of Justice announced that Facebook was one of four FAANG stocks being investigated due to internet monopoly concerns.
Some on the Street say Facebook is immune to the big tech investigations, even though the Federal Trade Commission dropped a $5 billion fine on it. They also cheer Facebook’s cryptocurrency initiative Libra. But regulators appear reluctant to let Libra fly. And the company’s earnings have been dragged down by the costs of ongoing investigations.
When Facebook reported an earnings miss back on July 25, 2018, the stock plunged sharply the next day. This was the fallout from the Cambridge Analytica privacy scandal that still remains under investigation. (Congress may ultimately decide to split up the company—which also owns the platforms Instagram, WhatsApp, and Messenger.)
The social media giant also missed quarterly earnings estimates for the last two quarters, reported on April 24 and July 24.
Facebook is still consolidating a bear market decline of 43.7% from its all-time intraday high of $218.62, set during the week of July 27, 2018, and its December 24 low of $123.02.
The stock set its 2019 high of $208.66 on July 25 and is trading 13.9% below this level—in correction territory.
Year-to-date, the stock’s performance is great. It may be in correction territory, but it’s still in a bull market—up 37% from its August 14 close of $179.71. That’s about 46% higher than its December 24 low of $123.
With an elevated price-to-earnings (P/E) of 31.42 and no dividend, the company is not a value play. It’s an investment for momentum traders… and its declining weekly slow stochastics make it a stock to sell on strength to the levels provided below.
Take a look at the daily and weekly charts. The weekly chart shows us risky levels that don’t appear on the daily chart. And both charts show the extreme volatility you often see in a FAANG stock.
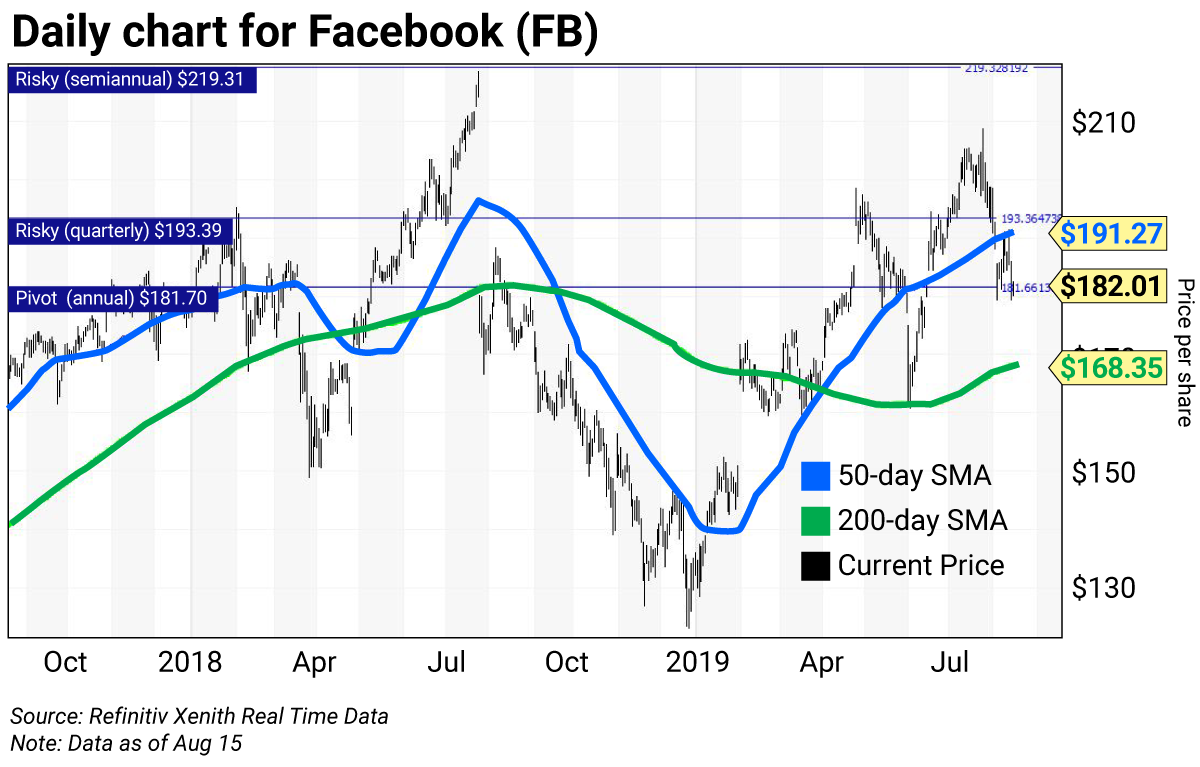
The daily chart for Facebook shows the stock has been above a golden cross since April 3, when the 50-day simple moving average (SMA) rose above the 200-day SMA to indicate higher prices lay ahead. The stock slipped to a test of its 200-day SMA at $161.39 on June 3, which was a buying opportunity.
The June 28 close of $193 was an important input to my proprietary analytics. The third quarter (Q3) risky level is $193.39, with a semiannual risky level at $219.31.
The July 31 close input of $194.23 resulted in a monthly risky level for August of $210.11. Note the price gap lower on July 25, 2018. As I mentioned above, this was a delayed reaction to the Cambridge Analytica scandal.
Still in play for the month is its annual pivot or “magnet” at $181.70.
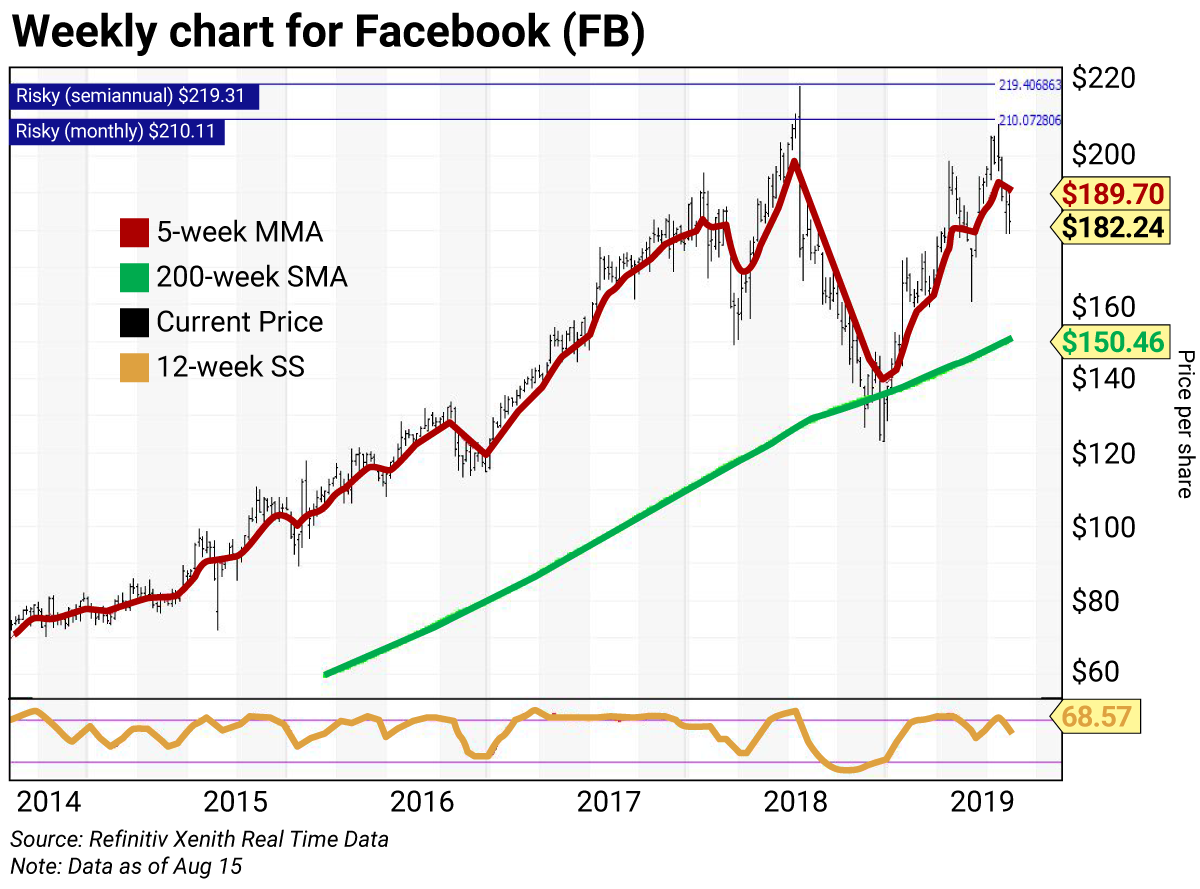
The weekly chart for Facebook is negative, with the stock below its 5-week modified moving average (MMA) at $189.70. The stock is well above its 200-week SMA or “reversion to the mean” at $150.46.
The 12-week slow stochastic (SS) reading along the bottom is projected to end the week at 68.57, down from 76.09 on August 9. (The stochastic reading scales between 0 and 100. Readings above 80 are considered overbought, and readings below 20 are considered oversold.)
The horizontal lines in each chart are Facebook’s strategic trading levels (see box below):
- Risky level (semiannual) $219.31
- Risky level (monthly) $210.11
- Risky level (quarterly) $193.39
- Pivot level (annual) $181.70
Value, pivot, and risky levels
Value, pivot, and risky levels pinpoint buy and sell levels and are a great tool for maximizing gains and limiting losses on stocks you plan to hold long-term.
Risky level: sits above where the stock is trading
Pivot level: often sits right around where the stock is trading. A pivot level is a value level or risky level that was violated within its time horizon. Pivots act as magnets that have a high probability of being tested again before the time horizon expires.
Value level: sits below where the stock is trading
The general idea is to buy around a value level line and reduce holdings around the risky level line. You can rebuild your position on weakness.
Trading strategy:
Buy Facebook (FB) on weakness to the 200-day SMA at $168.35 and reduce holdings on strength to its quarterly risky level at $193.39. The annual pivot remains a magnet at $181.70.

 | Rich Suttmeier Founder & CEO, Global Market Consultants |