
In the late ’60s, I got my first engineering job at Grumman Aerospace. We developed the lunar module that put man on the moon. And we designed the same F-14 Tomcat fighter jet “Maverick” and “Goose” flew in Top Gun.
The first rule of designing systems for the masses was to consider safety first. And we Grummanites took a hell of a lot of pride in ensuring that we did. Too bad Boeing’s (BA) management doesn’t seem to share that pride…
Since October, Boeing has experienced flight safety issues. A brand new Lion Air Boeing 737 MAX 8 crashed 13 minutes after takeoff in Indonesia. In February, an Amazon Prime cargo jet—a twin-engine Boeing 767—crashed in Texas.
The recent crashes and other close calls are reasons to be concerned about sustaining a solid order flow and future orders. I’ve been following the company closely on TheStreet.com (see articles below), advising investors on how best to handle Boeing’s volatility.
This week, the negative news for Boeing continues… The company faces a European Union list of demands in order for the 737 Max to fly again. In addition, Saudi Arabia canceled a $5.9 billion 737 Max order, favoring Airbus.
If you’re holding Boeing long-term, today’s chart shows you the best levels to add to your position… And when it’s time to reduce holdings.
Technical breakdown
For details on how to read the daily chart and its indicators, see the information box below.
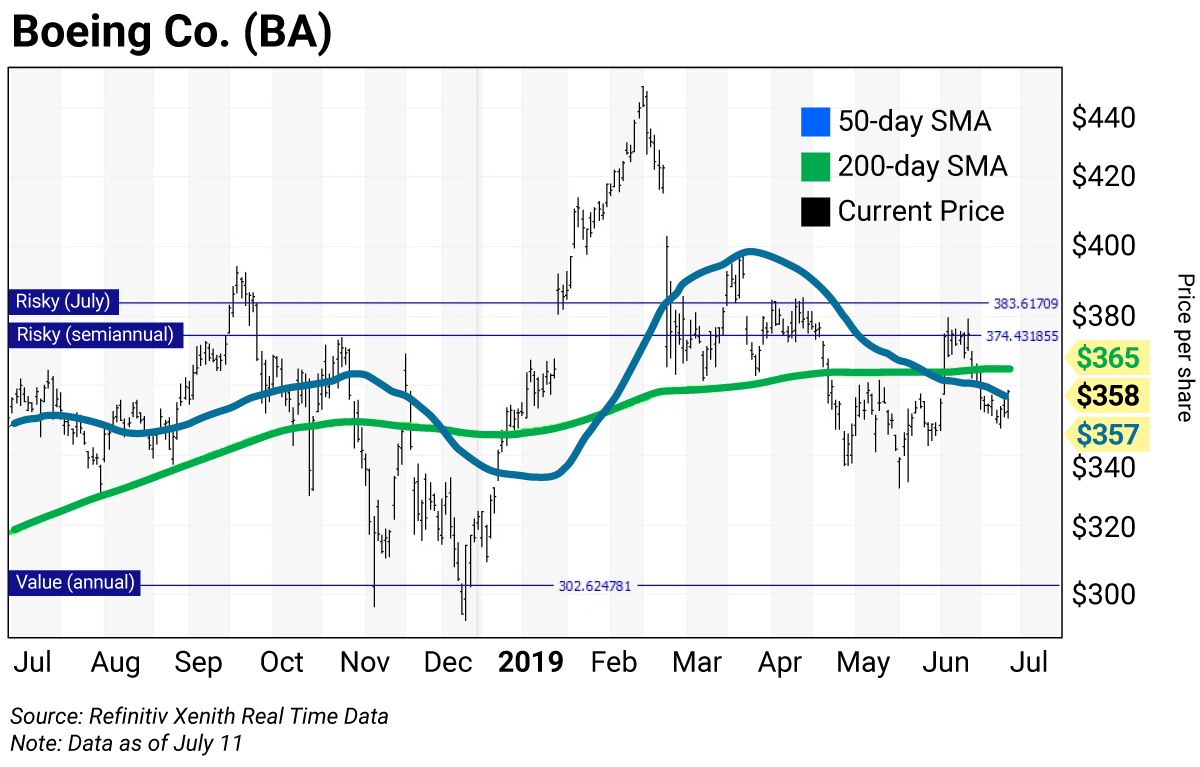
The daily chart for Boeing shows the stock set its all-time intraday high of $446 on March 1, months after the Lion Air Boeing 737 MAX 8 crashed in October 2018. Boeing beat analysts’ earnings-per-share estimates on January 30, which indicated the first crash was priced into the stock performance. This changed quickly with a price gap lower on March 11, caused by the Ethiopian crash.
Note that a “death cross” formed on June 13 when the 50-day simple moving average (50-day SMA) fell below its 200-day SMA, indicating lower prices ahead. These moving averages are at $357 and $365, respectively.
Trading strategy
The June 28 close of $364 was an important input into my analytics system. It gave semiannual and monthly risky levels of $374 and $383, respectively. And these levels are where investors should reduce holdings. (The quarterly risky level is above the chart at $473 and will likely not come into play.)
The annual value level remains at $303, which is the level to buy Boeing on weakness.
Boeing’s (BA) levels at a glance:
Value (annual): $303
Risky (semiannual): $374
Risky (July): $383
How to read daily charts and levels
The charts you’ll see in these pages are designed to help you determine the best price levels at which to add to a position on weakness or reduce holdings on strength.
I developed the technical parameters for the charts following the crash of 1987, using rigorous back-testing to come up with a methodology that resulted in the fewest false signals.
Daily charts provide a roadmap of how a stock has traded over the last 52 weeks and typically cover a time horizon of a rolling three to five weeks.
The daily bars (in black) show the high, low, and close for each day of the last 52 weeks, ending in the current price. The blue line is the 50-day simple moving average (50-day SMA). The green line is the 200-day SMA. These averages show levels of support or resistance as the stock trends higher or lower. (You can read more about SMAs here.)
The horizontal chart lines are the value, pivot, and risky levels. These lines pinpoint buy and sell levels and are a great tool for maximizing gains and limiting losses on stocks you plan to hold long term.
Risky level: sits above where the stock is trading
Pivot level: often sits right around where the stock is trading. A pivot level is a value level or risky level that was violated within its time horizon. Pivots act as magnets that have a high probability of being tested again before the time horizon expires.
Value level: sits below where the stock is trading
The general idea is to buy around a value level line and reduce holdings around the risky level line. You can rebuild your position on weakness.

 | Rich Suttmeier Founder & CEO, Global Market Consultants |
Editor’s note: Get Frank’s fundamental take on Boeing—and what he likes instead—in one of our favorite Wall Street Unplugged episodes.
More from Rich on Boeing:
Time to Book Profits on Boeing (February 26)
Boeing Flies Higher as Ethiopia Prepares Crash Report (April 1)
Sell Boeing on 737 MAX 8 Uncertainties, Negative Chart (April 8)
Sell Boeing on Strength and Production Uncertainties (April 23)
Sell Boeing on Credibility Concerns (May 7)
Why Boeing Just Became a Buy on Weakness (June 6)
Boeing Is Vulnerable as Quality-Control Issues Mount (July 1)