It’s brutal out there for investors right now. Stocks are stuck in a steep, weeks-long downtrend.
As you probably know, the selloff is mainly due to the Federal Reserve’s plan to tighten monetary conditions by raising interest rates this year.
A lot of folks are panicking. Some are giving up and selling.
But the smartest investors are looking for buying opportunities…
I’m not trying to diminish the pain investors are experiencing. But it’s my job to point out the opportunity that’s on the horizon.
And right now, an incredible one is taking shape.
Let me show you what I mean…
We’re nearing a critical indicator
As the pandemic took hold in March 2020, I wrote about an incredible buy signal approaching. The signal triggered within a few short weeks… and kicked off a massive bull market that lasted almost two years.
Today, we’re in a similar spot.
Let’s take a look at the Big Money—the large, institutional investors that drive the markets with their buying and selling. My colleagues and I created the Big Money Index (BMI), which tracks the Big Money activity on thousands of stocks… and simplifies it into a single index.
As you can see in the chart below, the BMI (the light blue line) has been chopping around for nearly a year due to rotations, even as the broad market—shown by the S&P 500 ETF (SPY)—kept rising in 2021.
After dipping below 40% last month, the BMI bounced. But it’s about to fall off a cliff as a result of the recent selling…

Above, I’ve included a green line at the 25% level. That line tells us when the stock market becomes extremely oversold. It’s a rare occurrence… happening only four times over the past five years.
The last time we hit the green line was on March 18, 2020 (the red circle on the left side of the chart). Investors who bought in late March or early April 2020 made huge gains over the next few months… though they had to wait a few excruciating weeks for the market to find a bottom.
The current BMI doesn’t appear to be near the green line. However, based on the next few charts, you’ll see why it’s likely to touch the 25% level soon…
Up next is a chart for the Big Money stock buys and sells. These are the signals that make up the BMI. The light blue bars show the number of buy signals each day… while red bars tell us how much selling is happening.
Put simply, we’re seeing the most selling in stocks since the pandemic lows in March 2020:
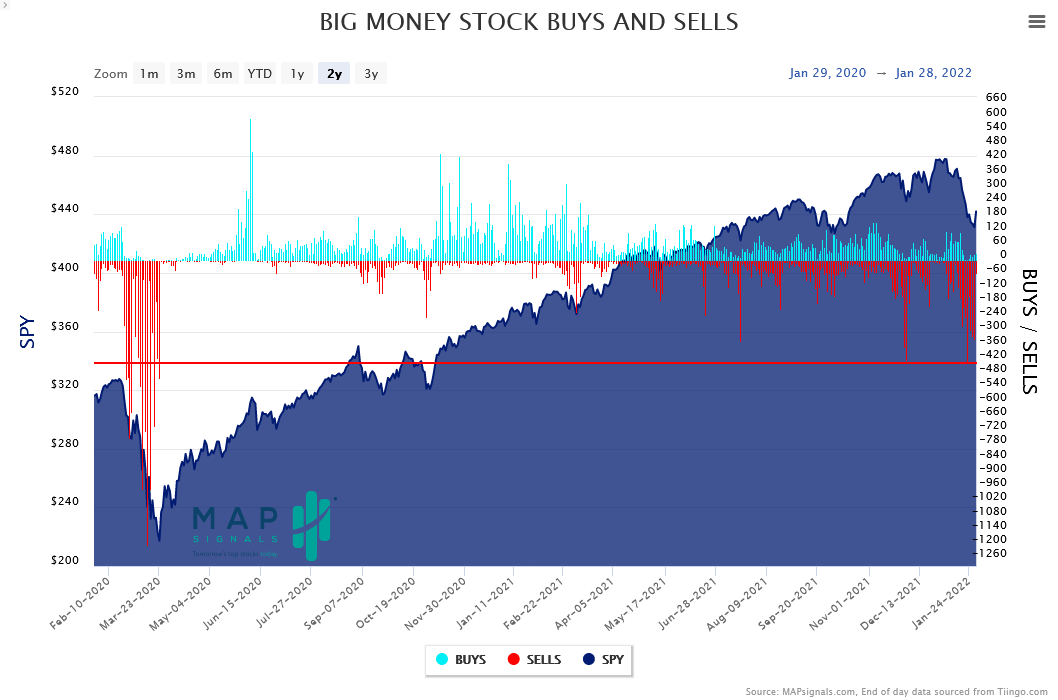
I’ve added a red horizontal line to show how the recent selling compares to March 2020.
And it’s not just stocks getting sold. ETFs are also seeing major selling. Again, I’ve added a red line to help compare the current selling to March 2020…
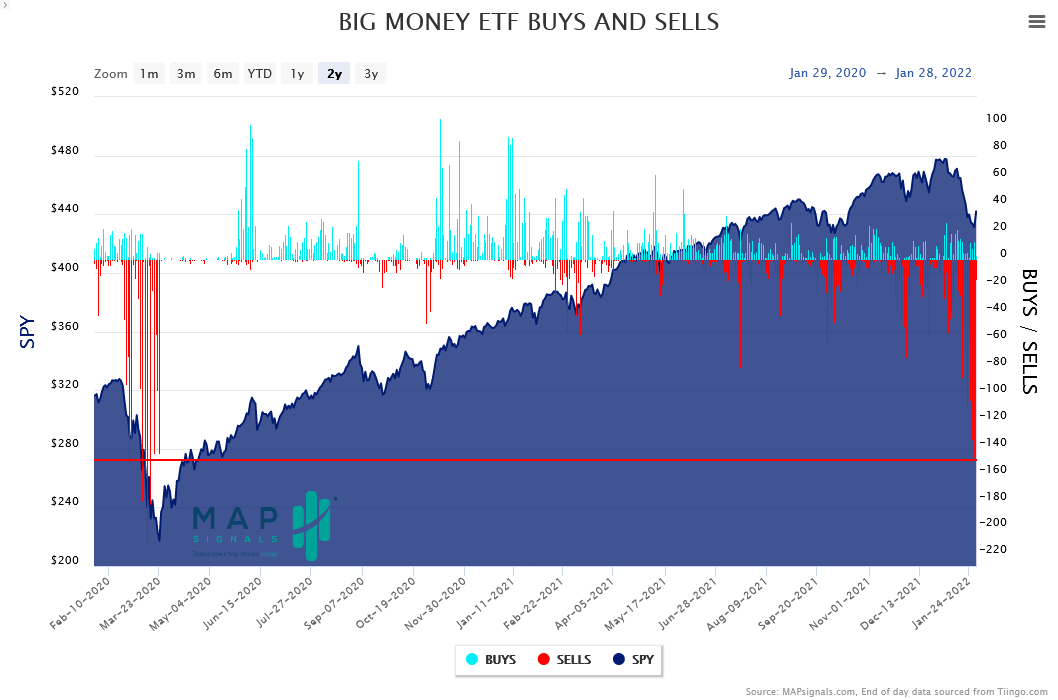
Like the previous chart, the recent selling hasn’t reached pandemic levels. However, I don’t expect it to.
The pandemic was a completely different animal compared to previous market panics. Uncertainty was off the charts as COVID triggered shutdowns throughout the world. There was no way to tell how bad things would get… or how long the economic impacts would last.
Plus, we didn’t know much about COVID at the time. And there weren’t vaccines or therapies to help reduce the spread.
The factors behind the current market turmoil are much less dramatic. The main concerns are inflation and rising interest rates, which the markets have dealt with countless times over the past century.
In other words, we don’t need to wait for the selling to reach March 2020 levels. It’s highly unlikely we’ll see an opportunity like that again.
Nevertheless, if we see a couple more weeks of nasty selling, we’ll likely pierce the green line. And as I’ll show you, it will be a great opportunity…
History says be ready to buy
If you’ve been investing for more than a couple of years, you know markets go through tough times pretty frequently. I’ve sat through countless selloffs… And I expect we’ll see many more in the future. It’s simply a part of investing.
These pullbacks are painful. But experience has taught me the importance of patience… and being ready to buy during a selloff.
If markets keep selling off, the BMI will likely hit oversold territory around February 11… roughly two weeks from now. As I mentioned earlier, the market doesn’t hit oversold levels very often. When it does, it’s a huge buying opportunity.
The table below shows the last four times the BMI hit oversold levels… and the performance of the S&P 500 over the next 12 months:
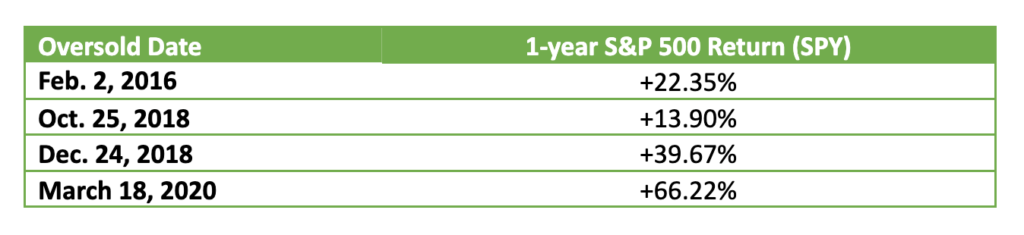
Put simply, investors made double-digit gains every single time this indicator went off in recent history.
Clearly, these were massive opportunities. Look at those returns—that is a lot of JUICE!
Telling people to get bullish at the peak of the pandemic probably sounded crazy at the time. But the data helped me avoid getting emotional when stocks were in a steep downtrend… and recognize the buying opportunity.
It’s been a brutal few weeks for investors. But it won’t stay like this forever. Using historical data can help us stay level-headed… and maximize opportunities when the market is full of turmoil.
If the market heads lower over the next few weeks, be ready to buy!
Editor’s note:
 History shows 4 assets consistently outperform during inflationary periods…
And if you invest in them today, you could not only protect your wealth from inflation… you could see major gains—while everyone else is losing money.
Find out what they are in Genia Turanova’s FREE special report, The Inflation Playbook.