Shares of drugstore giant CVS have been in recovery mode since mid-June. The company has been struggling to cut costs following its acquisition of health insurer Aetna last year.
This happens all the time in the business world. It can take years for one company to “digest” the company it bought and see the benefits of the acquisition.
CVS is the nation’s largest pharmacy chain. But, as the Aetna acquisition shows, the company is expanding into other areas of healthcare services.
For example, it’s turning its pharmacies into “mini emergency rooms” by adding a special area called the MinuteClinic. It’s a walk-in clinic where patients can get treatment for everything from sprains to the flu.
As CVS tries to carve out new territory in the healthcare sector, I’m seeing a great entry point to buy the stock.
As you can see in this week’s chart, shares of CVS are currently in “rebound mode” after shaking off the weakness I mentioned earlier. The stock is sitting near its weekly value level of $64.68, which is a good price to start considering a buy.
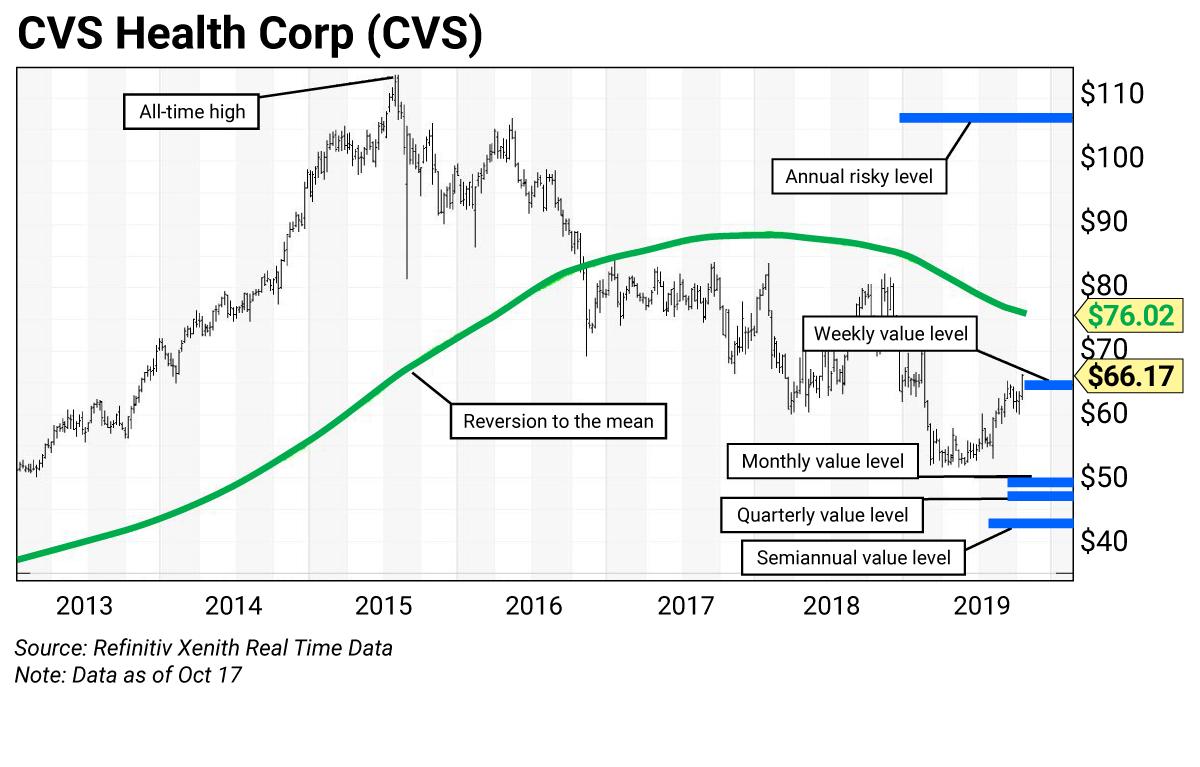
More importantly, the recent chart setup gives us an opportunity for a “reversion to the mean” trade. Strong technical momentum is driving the stock toward its technical mean level, which is the 200-week simple moving average (SMA) of $76.03. As you can see in the chart, CVS has been trading below its 200-week average for nearly three years.
By buying shares of CVS today, we can capture the gains as the stock works its way back to this level. That’s over 15% higher than where shares were recently trading.
The weekly chart shows the stock set an all-time intraday high of $113.65 in mid-2015. During November 2016, the stock broke through its 200-week moving average around $83.40. For investors, this was a negative signal that indicated a buying opportunity could be many months away.
After years of waiting, I see an attractive entry point to go long CVS. The stock recently broke above its five-week modified moving average (MMA), which indicates that the current upside move should continue.
Longer-term, I see even bigger upside if CVS can surge above its 200-week moving average. If the stock successfully breaks through this line, I expect it to head toward its annual risky level at $106.85.
Finally, it’s worth mentioning that shares of CVS offer a couple of strong fundamental reasons for going long. The stock is super cheap, with a P/E ratio of just 8.78, and long-term investors can benefit from the stock’s attractive dividend yield of 3.09%.
CVS’s trading levels
- Risky (annual): $106.85
- Value (weekly): $64.68
- Value (monthly): $49.07
- Value (quarterly): $47.07
- Value (semiannual): $42.74
Trading strategy
Buy CVS today on a positive weekly chart, cheap fundamentals, and healthcare initiatives.
Longer-term, add to positions on weakness to the monthly, quarterly, and semiannual value levels at $49.07, $47.07, and $42.74, respectively, and book profits on strength to the annual risky level at $106.85 (see box below for more on trading levels).
How to use trading levels
The trading levels on my charts pinpoint strategic buy and sell levels. They’re a great tool for maximizing gains and limiting losses on stocks you plan to hold long-term.
Value levels and risky levels are based upon the last nine monthly, quarterly, semiannual and annual closes. The first set of levels was based upon the market closes on December 31. The original annual level remains in play.
Value level: Sits below where the stock is trading.
Pivot level: Often sits right around where the stock is trading. A pivot level is a value level or risky level that was violated within its time horizon. Pivots act as magnets and have a high probability of being tested again before the time horizon expires.
Risky level: Sits above where the stock is trading.
To capture share price volatility, investors should buy on weakness to a value level and reduce holdings on strength to a risky level.

 | Rich Suttmeier Founder & CEO, Global Market Consultants |