
The green zone for small-cap stocks is near…
Over the past few weeks, I’ve warned about summer volatility. Looking at the historical data, August tends to be a rough time for stocks.
To protect yourself, I shared how to lower volatility in your portfolio.
But the end of summer is approaching. And as I mentioned in the post above… the last four months of the year (September to December) tends to be a great time for stocks.
Even better, the latest data shows signs of a new uptrend… which means it’s time to start getting more bullish.
Today, I’ll show you why the recent weakness is coming to an end… and why small caps are the best area to target for near-term upside.
First, let’s take a look at the “big picture” for the stock market, which shows an important reversal.
My favorite index surged last week
Weeks ago, I pointed out how ugly the data has been for stocks. The major indices were heading higher, but many stocks were selling off.
We can dig deeper into the stock market action by looking at the Big Money Index (BMI), which tracks institutional buying and selling in stocks. When it falls, it means the number of stocks getting sold is greater than those getting bought.
On the other hand, when it rises, it means demand for stocks is picking up. And that’s exactly what happened last week:
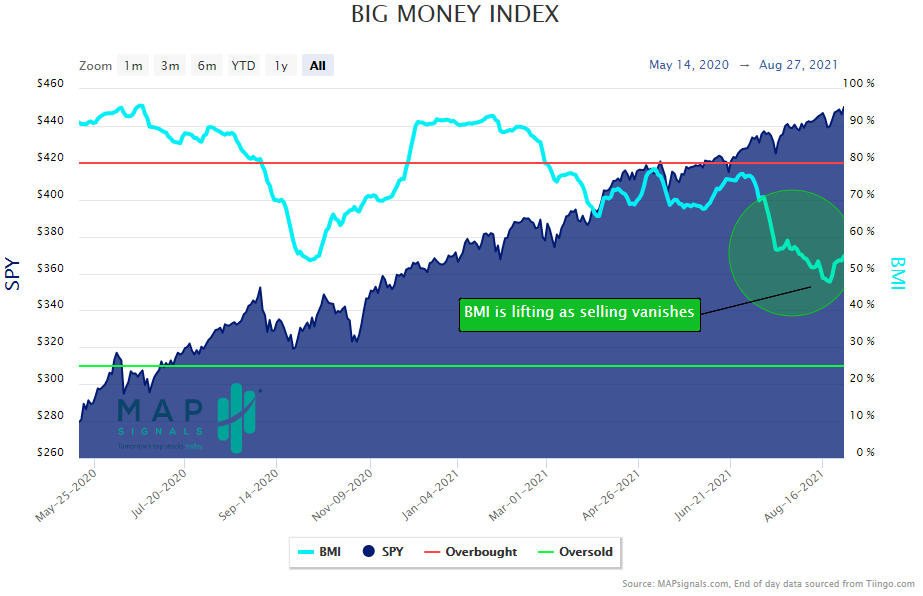
As you can see, the BMI suffered a big drop over the past two months. But last week’s action looks like the start of a rebound. In other words, the downtrend is reversing.
This is especially interesting because the biggest weakness was in small-cap stocks.
Over the past two months, the S&P 500 and NASDAQ 100 are up 5.3% and 6.3%, respectively.
By contrast, the Russell 2000—the most widely-followed gauge for small caps—fell 1.75% over that same timeframe. That’s massive underperformance.
To understand why, we need to dig into the data a bit… by looking at the buying and selling by market cap. This gives us a better idea about what kind of stocks institutional investors were buying… and what they were selling.
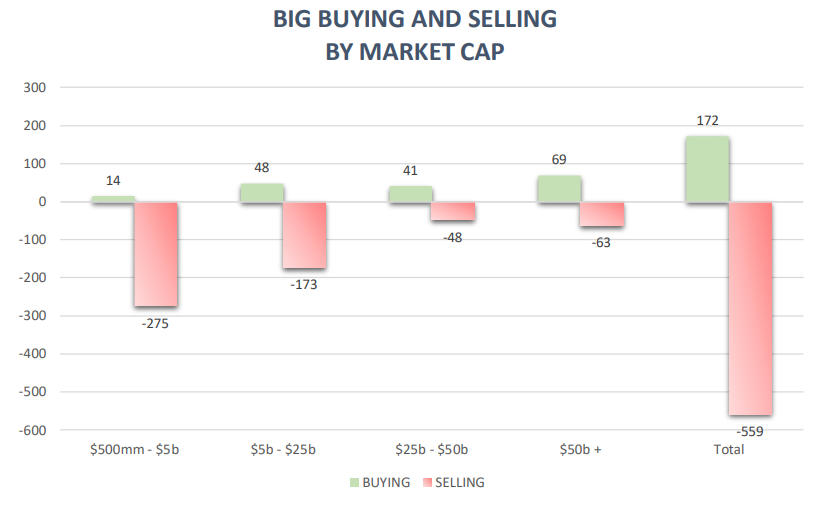
Below, you can see a breakdown of the buying and selling from two weeks ago (August 16-20). The most important part is the small-cap data on the left side:
Click to enlarge
Notice how much worse the data is for small caps? The further left you go, the bigger the red bars get. In that week alone there were 18 times more stocks getting sold than bought (275 sells vs. just 14 buys) for market caps of $500 million to $5 billion.
That’s a ton of selling… and the main reason the BMI was in free fall.
Small-cap selling turns into buying
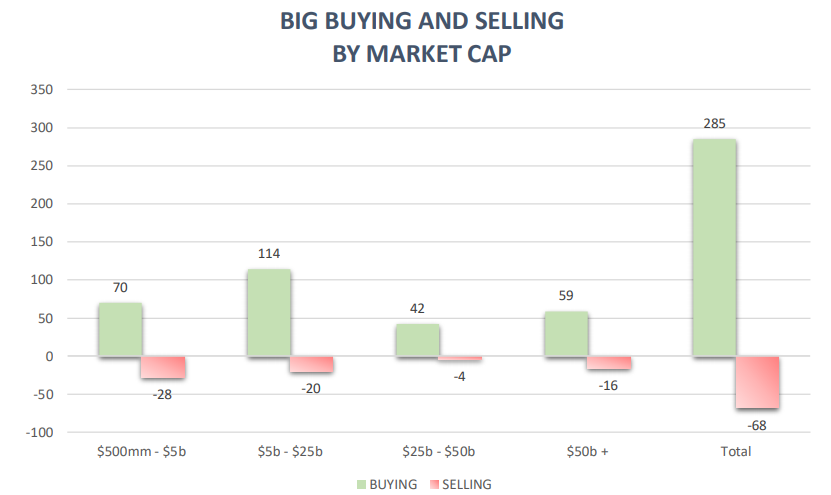
But last week, the small-cap selling suddenly vanished. Here’s the same chart… but with last week’s buying and selling data (August 23-27):
Click to enlarge
If we focus on small caps (the leftmost data set), we see buyers outstripped sellers by more than double (70 buys vs. just 28 sells). This is exactly why the BMI popped last week.
And it also tells us where the opportunity is…
Last week’s action breaks a long downtrend for small caps. As I mentioned above, big institutions have been dumping the stocks of smaller companies for over two months.
In short, I expect small caps to keep building a new uptrend in the coming weeks.
That’s why now’s the time to bet on small caps…
A “one-click” way to capture upside from small caps
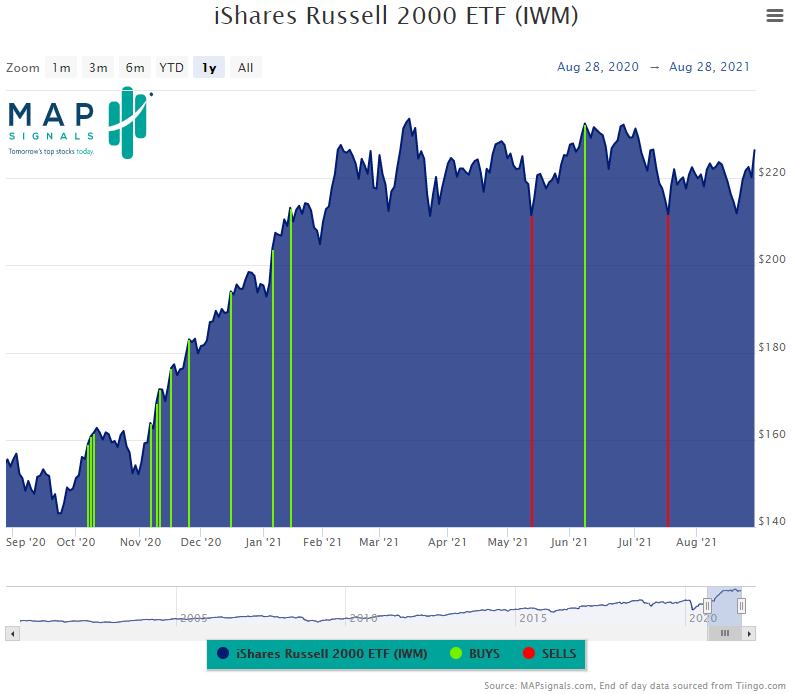
The iShares Russell 2000 ETF (IWM) is one of my favorite ways to play the uptrend in small caps.
Below, I’ve included a one year chart of IWM overlaid with Big Money buy (green) and sell (red) signals. As you can see, the fund has traded sideways for the past six months or so.
Here’s the bottom line…
Small-cap companies have massively underperformed… But, the data signals a strong current flowing into those stocks. And IWM is a great “one-click” way to capture the potential upside over the next few months.
And to learn which individual stocks will benefit from this changing tide, be sure to check out my advisory, The Big Money Report, where I showcase the hottest growth stocks on my radar—the ones Big Money investors are pouring into.