It’s 2008 all over again.
At least that’s what CNN Money’s Fear & Greed Index is telling us.
During the credit crisis, Lehman Brothers filed for bankruptcy and the Treasury Department placed Fannie Mae and Freddie Mac into conservatorship.
The stock market crashed … home values fell by more than 25% … unemployment rose to 10% … and our entire financial system was on the verge of collapse.I’m sure you know the story by now. It was one of the scariest times in the history of the markets. Most investors sold stocks regardless of valuation.
Today, investors are just as terrified to own stocks. I understand why. The markets are down about 10% to start the year. And we still have another week left of trading in January.
But before you dump all of your positions, there is something you should know.The last time the Fear & Greed Index hit these levels, the S&P 500 popped 10% in a month.Let me explain …
The Fear & Greed Index is used to gauge the primary emotions that drive investors. This includes fear and greed — which are measured using seven indicators. They include:
1. Stock Price Momentum: The S&P 500 vs. its 125-day moving average
2. Stock Price Strength: Number of stocks hitting 52-week highs and lows
3. Stock Price Breadth: Volume of shares trading on the rise vs. declining
4. Put and Call Options: Trading volume of bullish call options relative to bearish put options
5. Junk Bond Demand: Spread between investment-grade and junk-bond yields
6. Market Volatility: Tracking the Volatility Index (VIX)
7. Safe Haven Demand: Difference in returns for stocks vs. bonds
CNN Money does a great job of combining all seven indicators and translating them into an easy-to-read system for investors. You can read more about it here.
This system is displayed on a scale from 0 to 100. A reading below 25 indicates investors are “extremely fearful,” with 0 being the most extreme. A reading above 75 indicates investors are “extremely greedy,” with 100 being the most extreme.The Fear & Greed Index is used as a contrarian indicator. For example, when investors are greedy it’s usually a good time to sell stocks. And when investors are fearful it’s generally a good time to buy stocks.
Readers should be familiar with this index.
I wrote about it in these pages in September. This was shortly after the Dow Industrials fell 1,000 points in one day. The Fear & Greed Index hit 15 at the time. That’s an “extreme fear” reading, or usually a great time to buy stocks.By the end of October, the markets surged 10%. That’s a major move for the large-cap index in such a short period.If you bought stocks when investors were “extremely fearful” — you made a nice short-term score.Today, the Fear & Greed Index is at 8, much lower than the 15 reading the index showed in September. That’s means investors are “extremely fearful” to own stocks.Remember, this index is a contrarian indicator. The lower the number, the greater the chance stocks will bounce in the short term.So don’t be surprised if we see another sharp rally in the near term.
Read the signs. Beat the market.
The market intelligence you need to invest one step ahead. Go beyond the headlines. Invest with an insider’s edge.
Books are a big part of Wall Street culture. Luke shares his favorite book of all time… and the simple lesson that helped him find the path to big, long-term investment gains.
Learn why Chinese property manager Evergrande rocked the market this week… why it poses a threat to the global economy… and why U.S. investors should invest in China with caution.
It’s time to put on our rally hats… As we near the end of the year, we’re about to enter the mega green zone for stocks. And Luke’s spotted two ETFs primed for huge gains...
OpenAI's HuggingFace debacle: Is AI a cybersecurity risk? Plus, SuperMicro's (SMCI) margins… Open-source vs. closed-source AI models… 2 no-brainer AI power winners… The sector with the most AI risk… China's market manipulation… And stay cautious on SpaceX (SPCX).
DigiPower X (DGXX) CEO Michel Amar breaks down the company's milestone contract with Cerebras (CBRS)… its AI stack roadmap, from real estate to GPU-as-a-service… key catalysts through 2026… and why DigiPower X is in a league of its own.
IBM's (IBM) worst day in 58 years—is it a buying opportunity? Plus, Fed Chair Warsh's testimony… The odds of a rate hike dropped significantly… Two AI buys… The perfect backdrop for big banks… And Wrap's (WRAP) growing TAM.
Meb Faber, cofounder and chief investment officer of Cambria Investment Management, breaks down his new book on the rise of the 250-year bull market… and how much longer it can last. Plus, why U.S. investors should look abroad.
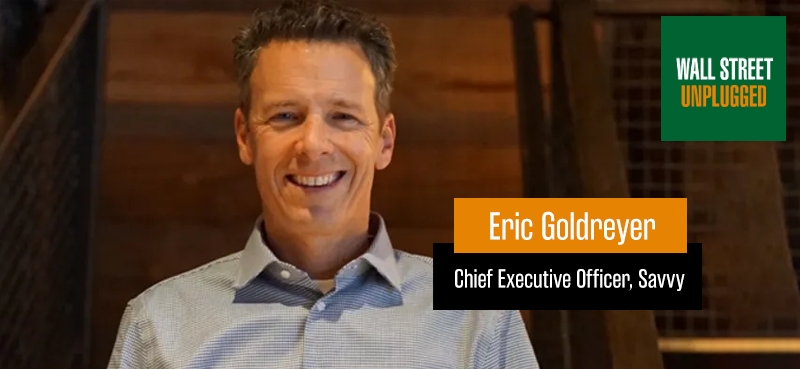
Savvy CEO Eric Goldreyer breaks down the secret to the company's success—and its next growth phase… how AI is helping unlock customer savings… and his exit plan for this hospitality disruptor.
These tech stocks are buys on the pullback. Plus, is it still a "buy-the-dip" market? … What's driving the outperformance in small caps? … Steer clear of this SPAC… Accenture's (ACN) management should be fired… And the broken housing market.
Iran reportedly suspended indirect talks with the U.S. and is threatening to completely block the Strait of Hormuz. That matters because roughly 20% of the world's oil flows through this narrow chokepoint. Here's what it means for oil prices, energy…
The U.S. is tightening sanctions on Iran's oil network. But Iranian barrels are still moving through China and a shadow fleet of tankers, shell companies, and middlemen. Here's why that fragile workaround system matters for crude prices—and energy stocks.
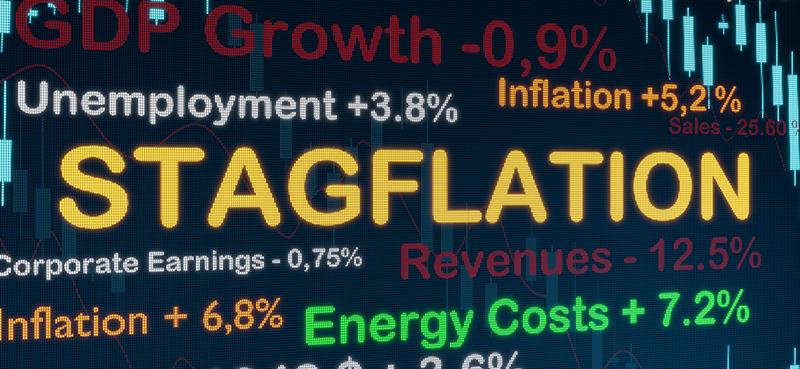
The latest economic data has revived fears of stagflation—a painful mix of weak growth and stubborn inflation. But today's economy isn't the 1970s. Here's what the numbers actually say… and what investors should watch next.
AI is this century's gold rush—and the biggest fortunes will once again go to the companies selling the "shovels." These seven sectors are providing the energy and infrastructure to power the AI boom.
Oil’s sustained price is a major indicator that few are watching. If crude stays elevated, it could keep inflation sticky, limit the Fed’s flexibility, squeeze corporate margins, and shift market leadership. Here’s how to position your portfolio.
War-risk insurance premiums on Strait of Hormuz transits have surged from pre-war levels, and shipping traffic has collapsed by roughly 95%. Here's how insurers are controlling oil transit… and what it means for your portfolio.
The Trump administration plans to drop $2 billion on nine quantum computing companies in exchange for equity stakes. IBM (IBM) gets the biggest slice, but the pure-play names are seeing the real upside. Here's what this signal means for investors.

 It’s 2008 all over again.
At least that’s what CNN Money’s Fear & Greed Index is telling us.
During the credit crisis, Lehman Brothers filed for bankruptcy and the Treasury Department placed Fannie Mae and Freddie Mac into conservatorship.
The stock market crashed … home values fell by more than 25% … unemployment rose to 10% … and our entire financial system was on the verge of collapse.I’m sure you know the story by now. It was one of the scariest times in the history of the markets. Most investors sold stocks regardless of valuation.
Today, investors are just as terrified to own stocks. I understand why. The markets are down about 10% to start the year. And we still have another week left of trading in January.
But before you dump all of your positions, there is something you should know.The last time the Fear & Greed Index hit these levels, the S&P 500 popped 10% in a month.Let me explain …
The Fear & Greed Index is used to gauge the primary emotions that drive investors. This includes fear and greed — which are measured using seven indicators. They include:
It’s 2008 all over again.
At least that’s what CNN Money’s Fear & Greed Index is telling us.
During the credit crisis, Lehman Brothers filed for bankruptcy and the Treasury Department placed Fannie Mae and Freddie Mac into conservatorship.
The stock market crashed … home values fell by more than 25% … unemployment rose to 10% … and our entire financial system was on the verge of collapse.I’m sure you know the story by now. It was one of the scariest times in the history of the markets. Most investors sold stocks regardless of valuation.
Today, investors are just as terrified to own stocks. I understand why. The markets are down about 10% to start the year. And we still have another week left of trading in January.
But before you dump all of your positions, there is something you should know.The last time the Fear & Greed Index hit these levels, the S&P 500 popped 10% in a month.Let me explain …
The Fear & Greed Index is used to gauge the primary emotions that drive investors. This includes fear and greed — which are measured using seven indicators. They include: If you bought stocks when investors were “extremely fearful” — you made a nice short-term score.Today, the Fear & Greed Index is at 8, much lower than the 15 reading the index showed in September. That’s means investors are “extremely fearful” to own stocks.Remember, this index is a contrarian indicator. The lower the number, the greater the chance stocks will bounce in the short term.So don’t be surprised if we see another sharp rally in the near term.