Floridians, Georgians, Carolinians, and even Virginians have crowded their local Home Depot stores for supplies to shore up their homes and businesses against Hurricane Dorian.
As a result, shares of Home Depot (HD) traded to an all-time intraday high of $229.27 on August 30.
The daily chart below shows the stock above a “golden cross” since April 15, when the blue 50-day simple moving average (SMA) rose above the green 200-day SMA, indicating higher prices will follow.
Daily charts provide a roadmap of how a stock has traded over the last 52 weeks and typically cover a time horizon of a rolling three to five weeks.
The daily bars (in black) show the high, low, and close for each day of the last 52 weeks, ending in the current price. The moving averages show levels of support or resistance as the stock trends higher or lower. (Read more about SMAs here.)
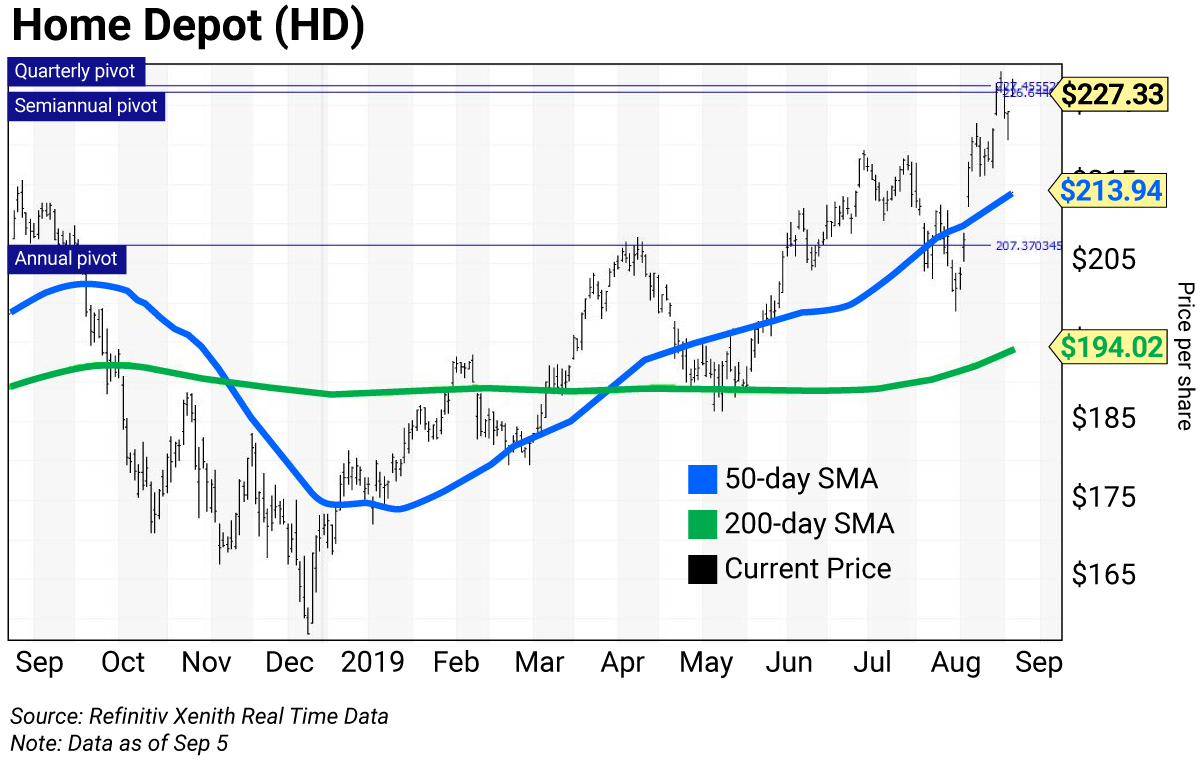
Yesterday morning, the stock crossed its semiannual and quarterly pivots at $226.64 and $227.45, respectively. And it’s now poised for a test of its September risky level at $235.20. Plus, the stock isn’t fundamentally cheap—its P/E ratio is 22.29, with a dividend yield of 2.39%.
The need for plywood and other home fortification products—not to mention post-hurricane repairs—will only increase household debt. Home Depot faces the risk that homeowners will return the home protection products they didn’t need. But in the longer term, it faces the bigger issue of increasing household debt and shrinking revenues.
I mentioned last week that most households on Main Street USA continue to live paycheck to paycheck. Homeowners may be forced to tap the record $6.3 trillion in appraised home equity versus their mortgage debt. This available cash grew by about $335 billion in the second quarter.
It’s estimated that 45 million households have excess equity and about half have mortgages that can be refinanced at today’s posted mortgage rate of 3.49%. The problem with refinancing is that homeowners will be increasing mortgage debt just as household debt increases. At the same time, mortgage delinquencies are on the rise.
This is why I’ve warned of a recession. And why it’s time to book profits on Home Depot…
The horizontal lines in the chart are Home Depot’s strategic trading levels (see box below):
- Risky (monthly): $235.20 (above the chart)
- Pivot (quarterly): $227.45
- Pivot (semiannual): $226.64
- Pivot (annual): $207.37
Trading strategy
Book profits on Home Depot (HD) on strength towards the September risky level of $235.20.
This call is based upon the high probability that the stock returns to its annual pivot at $207.40. This level was a magnet between April 18 and August 19.
How to use trading levels
Value, pivot, and risky levels on a chart pinpoint strategic buy and sell levels. They’re a great tool for maximizing gains and limiting losses on stocks you plan to hold long-term.
Risky level: sits above where the stock is trading
Pivot level: often sits right around where the stock is trading. A pivot level is a value level or risky level that was violated within its time horizon. Pivots act as magnets and have a high probability of being tested again before the time horizon expires.
Value level: sits below where the stock is trading
The general idea is to buy around a value level line and reduce holdings around the risky level line. You can rebuild your position on weakness.

 | Rich Suttmeier Founder & CEO, Global Market Consultants |