
A fairly rare event occurred last week… The amount of selling in stocks hit a level we’ve only seen a few dozen times over the past 20 years.
It’s no secret that the past few months have been a tough slog for investors. Since the start of the year, the S&P 500 is down about 12%. And the Nasdaq has been even worse… losing about 18% in less than three months.
But the level of selling last week indicates a lot of negativity is already priced into the market… and the bulls may be reawakening soon.
I know it’s tough to be bullish after seeing your portfolio take a big hit. But as I’ll show you, widespread selling typically leads to double-digit gains for investors willing to hold for at least 12 months.
A rare event for the Big Money data
If you’ve been following me for a while, you know I love data. Numbers help reveal what’s really going on in the stock market… and historical data can give us an idea of what to expect in the future.
The Big Money data tells us what institutional investors are doing. Not surprisingly, they’ve been selling a lot lately. And last Monday (March 7) was the single biggest selling day in almost two years.
Out of 1,339 stocks trading on big volumes that day, 461 logged sell signals. In other words, more than 1/3 of the biggest stocks in the market saw massive selling. (The 1,339 stocks include those that trade at least 500,000 shares a day on average and aren’t penny stocks. They’re the names that big institutions tend to focus on.)
That 461 number is bigger than any of the drawdowns we saw in recent months. Below, you can see some big selling in December and January… but last Monday’s selling tops the previous levels. I’ve highlighted the biggest selling by adding yellow boxes. Take a look:
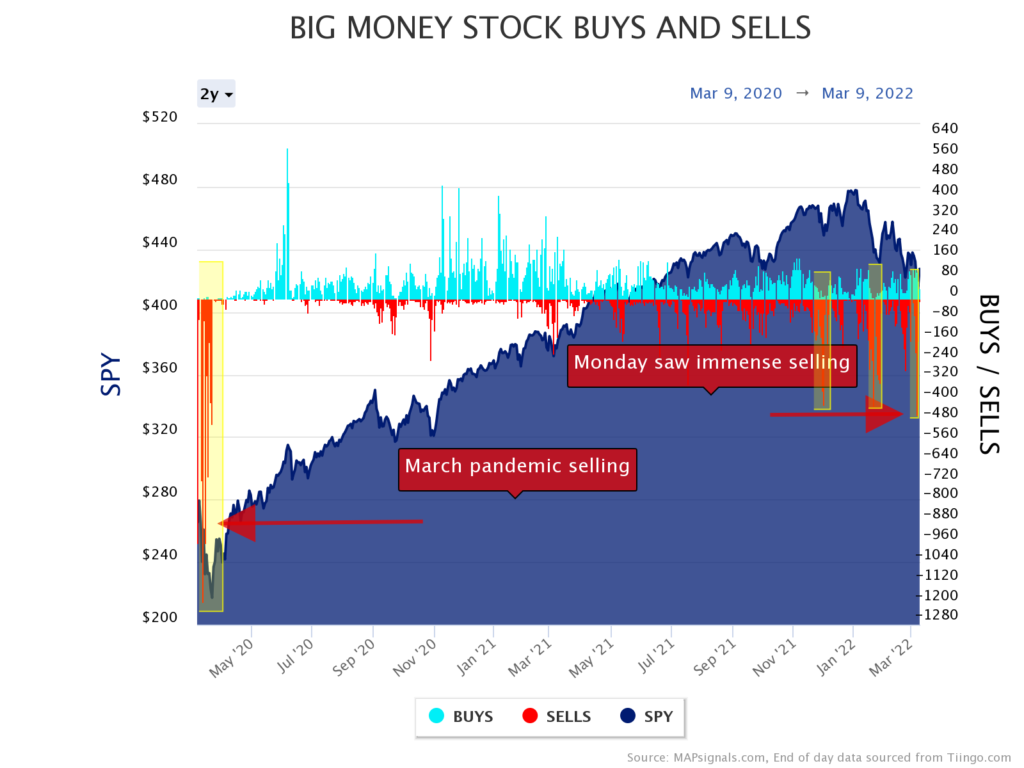
Last week’s result is all the way on the right… and you can see how it surpassed the other big selling days in recent months. While still nowhere near as big as what we saw during the pandemic two years ago, having 400-plus sell signals in one day is a pretty rare event for the Big Money data.
Let’s dig a little deeper to see what usually happens when we see this level of selling in the stock market…
Big selling leads to double-digit gains
To keep things relatively simple, I went through the last 20 years of Big Money data and compiled all the days when there were at least 400 stocks generating sell signals. In short, I want to focus on the days that were similar to last Monday… to see what happened over the next year.
Since 2002, we’ve only seen 61 days where the selling hit 400-plus. As you can see above, three of these days happened over the past few months… so we need to exclude them from our data set. (Since they just happened, we don’t have a full year of performance to include in our data.)
That leaves us with 58 days of big selling from 2002 through early 2021.
Next, I tracked the performance of the S&P 500 (represented by the SPY ETF) for the 12 months following each of these selling days. You can see the summary in this one simple table:

You can see there were 58 separate days of big selling since 2002. Over the next week, the average S&P 500 performance was down slightly (-0.1%). But the performance turns positive as you look at the following 1-, 3-, 6-, and 12-month periods.
You can see the average 12-month return for the S&P 500 is just over 20% following a big selling day.
Drilling down even further, 47 of the 58 data points generated a positive return over the next 12 months. In other words, if you bought the S&P 500 on a big selling day, you made money 81% of the time by holding over the next year.
And get this: All 11 of the negative results came from the same time period—the 16 months from July 2007 to October 2008. In other words, the only time this buy signal didn’t work was at the start of a the Great Recession (a once-in-a-generation event).
If we exclude the entire crisis (which includes the 11 negative results plus 7 positives from October 2008 through March 2009), we’re left with 40 historical data points to consider.
I don’t want to shrug off the financial crisis, but the table below is pretty incredible when you consider it still includes more than 18 years of data:

That’s a 100% win rate… for an average gain of 29.4% in the 12 months following a big selloff. That’s amazing.
Again, I don’t want to imply that the current bear market is over. We’ll likely see continued volatility in the coming months.
However, it’s impossible to ignore this historical data. Outside of a major financial crisis, recent history shows that the market was higher (after 12 months) 40 out of the last 40 times we saw major selling. And even including the numbers from the financial crisis, it’s still an average 20% gain and a win rate over 80%.
Put simply, now is a great time to build your watchlist. Take your time and slowly find buying levels on names that you’re happy to own for the long-run. History tells us the market will likely be higher a year from now. And the investors who hang tough during the current rough patch will end up being big winners.
In the meantime, not every area of the market is getting hit. I’ve talked before about how money is flowing into supply chain winners. Money is also moving into commodities, especially fertilizer.
Remember… over the past two decades, we made it through a pandemic and a generational financial crisis. These selloffs eventually give way to brighter skies. Hang in there!
P.S. As money pours into commodities, our latest Big Money Report pick is reaping the benefits.
Amid the massive market uncertainty… this “unsexy” name is up over 40% in just three weeks.
To find out what Big Money investors are buying next, join The Big Money Report today.