Today’s Chart of the Week gives us a great example of how you can use my system to successfully trade around a stock’s overbought and oversold conditions.
Back on August 2, I recommended buying Citigroup (C).
As I explained to readers, there were multiple positive indicators on the chart. One important signal was a “golden cross” that happened in May, when the 50-day simple moving average (SMA) started to trade above the 200-day SMA.
My advice at the time was, “Buy Citigroup (C) on weakness to the quarterly and semiannual pivot/value levels at $68.15 and $67.85, respectively. Add to positions on weakness to its monthly value level at $65.86.“
Within a couple weeks, shares fell to around $60—well below all three monthly value levels.
Today, shares are up about 15% since the end of August, but our downside risk increases as the stock moves higher…
That’s why it’s time to book profits on Citigroup.
On the chart below, you can see Citigroup’s current value and risky levels. The stock is well above both its quarterly and annual value levels of $61.25 and $55.22, respectively. (These are the key levels we would want to consider buying the stock.)
More importantly, Citigroup is now trading above its monthly and semiannual risky levels of $72.31 and $67.87, respectively. And it’s getting close to its $76.75 weekly risky level.
Here’s why that matters…
Whenever you buy a stock at value levels, the risky levels become your price target. When a trade hits its price target, it’s time to book profits.
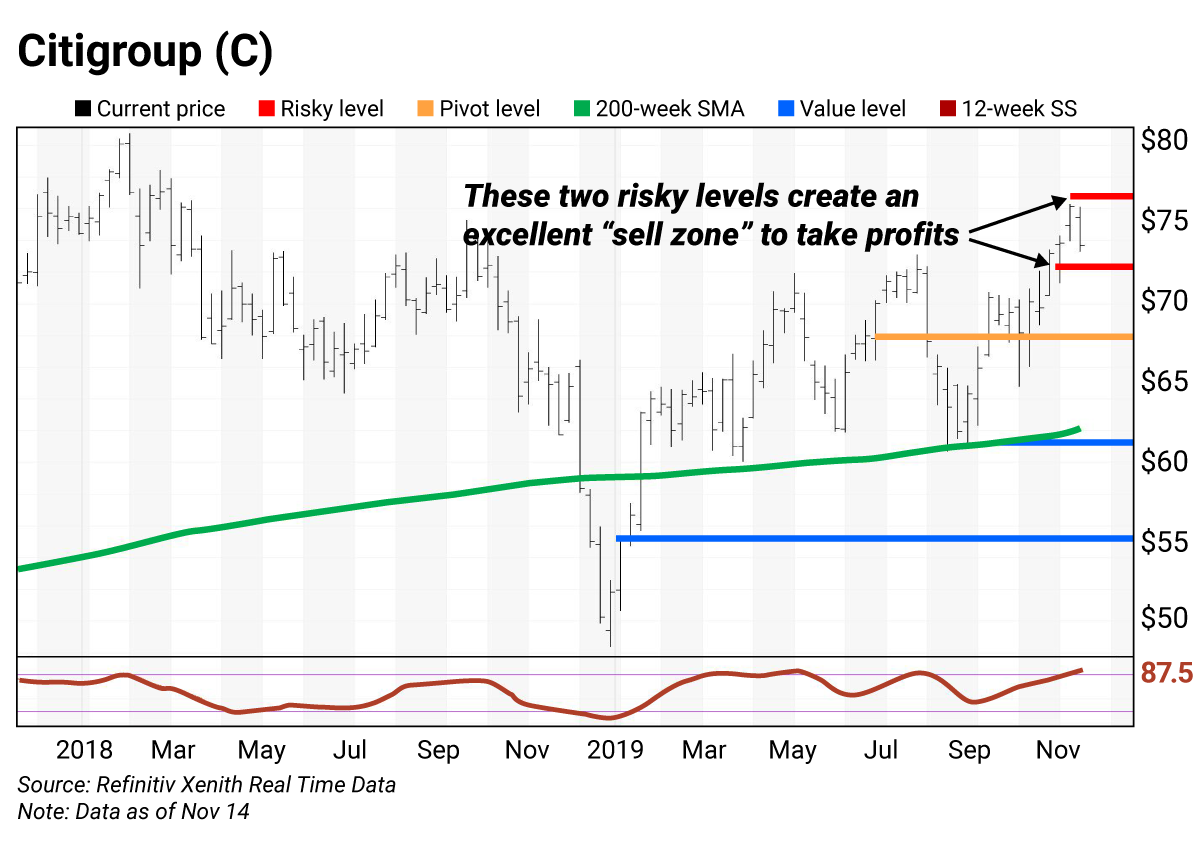
This call is supported by another key indicator I track that shows shares of Citigroup have become extremely overbought: the 12-week slow stochastic (SS) reading. It’s the red line at the bottom of the chart that “wanders” between 0 and 100. Right now, it’s at 87.5, and next week this reading will likely rise above 90.
This is a major red flag for traders. When a stock rises above this level, it usually projects downside risk of 10% to 20%, possibly more.
It’s no surprise that Citigroup (and other banks) are seeing their stock prices go up…
Interest rates are low, and the Federal Reserve is committed to keeping them low to help the economy.
At its October 30 FOMC meeting, the Fed cut the federal funds rate to a range of 1.5% to 1.75%. Comments by Fed Chair Jerome Powell implied there would be a pause in future rate cuts. Inflation for goods other than food and energy remain below their 2% target.
Shares of Citigroup have continued to rise since. The stock is up more than 9% from its closing price on August 2, the day of my recommendation. If you waited a few days to get a better price, you’re up even more.
A 9% profit is a solid gain for a 3-month trade.
The important thing is paying attention to the chart. My system looks at closing prices over multiple timeframes. It calculates the value levels (where a stock should be bought), as well as the risky levels (where we should look to sell a stock).
In August, we added to our Citigroup position in a “buy zone”… Today, we’re taking money off the table in a “sell zone.”
By following my levels system, you can continually maximize profits on stocks most investors simply buy and hold…
Trading Strategy: Sell Citigroup (C) at today’s risky levels. You can add to your position when it returns to value levels.
Citigroup trading levels:
- Risky (weekly): $76.75
- Risky (monthly): $72.31
- Pivot (semiannual): $67.87
- Value (quarterly): $61.25
- Value (annual): $55.22
How to use trading levels
The trading levels on my charts pinpoint strategic buy and sell levels. They’re a great tool for maximizing gains and limiting losses on stocks you plan to hold long-term.
Value levels and risky levels are based upon the last nine monthly, quarterly, semiannual and annual closes. The first set of levels was based upon the market closes on December 31. The original annual level remains in play.
Value level: Sits below where the stock is trading.
Pivot level: Often sits right around where the stock is trading. A pivot level is a value level or risky level that was violated within its time horizon. Pivots act as magnets and have a high probability of being tested again before the time horizon expires.
Risky level: Sits above where the stock is trading.
To capture share price volatility, investors should buy on weakness to a value level and reduce holdings on strength to a risky level.

 | Rich Suttmeier Founder & CEO, Global Market Consultants |