
In July 2005, I predicted the coming demise of the housing market. Since then, I’ve been covering homebuilder stocks on a monthly basis, updating readers as new data becomes available.
Each month, the National Association of Home Builders (NAHB) releases its Housing Market Index (HMI). The following day, housing start data is released. These important releases help determine the trading strategies for homebuilder stocks.
While the latest data shows improvements in the housing market, it lags behind its potential. As you’ll see, four of the five major homebuilders I track are no longer fundamentally cheap… but still well below their 2005 highs… and risky levels are being tested.
Below, I’ll tell you the levels where you should book profits…
On September 17, the NAHB announced its HMI for the month rose a point to 68, the highest level of the year (well above the neutral reading of 50), which implies builder confidence. It also reported solid demand for single-family homes primarily due to lower mortgage rates.
On September 18, the U.S. Housing and Urban Development and Commerce Department reported that single-family housing starts increased by 4.4% in August, to 919,000 units. The big question is whether potential buyers can afford to buy now.
Despite strong numbers, single-family starts are down 2.7% year to date. New home sales will be released on September 25, which will give us a read whether buyers are closing sales.
Homebuilders also face challenges that hurt home affordability, such as a shortage of buildable lots and labor. The NAHB remains concerned about the trade disputes with China. Around the country, areas that count on manufacturing are struggling, while rural and suburban areas are seeing demand.
On September 18, the Mortgage Bankers Association (MBA) reported mortgage applications to purchase a home rose 6% last week, and are up 15% year over year (YoY). This may sound good, but it can take weeks for an application to finally be approved. (Mortgage applications apply to both new and existing homes.) Applications are up 33% YoY for new homes. But rates are up to 4% (from 3.5%) in recent weeks—and these low rates only apply for a home buyer making a 20% down payment.
We know that increasing household debt remains a problem on Main Street.
Below is the NAHB/HMI index vs. single-family housing starts. The blue line is the HMI and the red line is single-family starts, based on the month prior. Note that single-family starts peaked around 1.8 million in mid-2005, which is when the homebuilder stocks peaked.
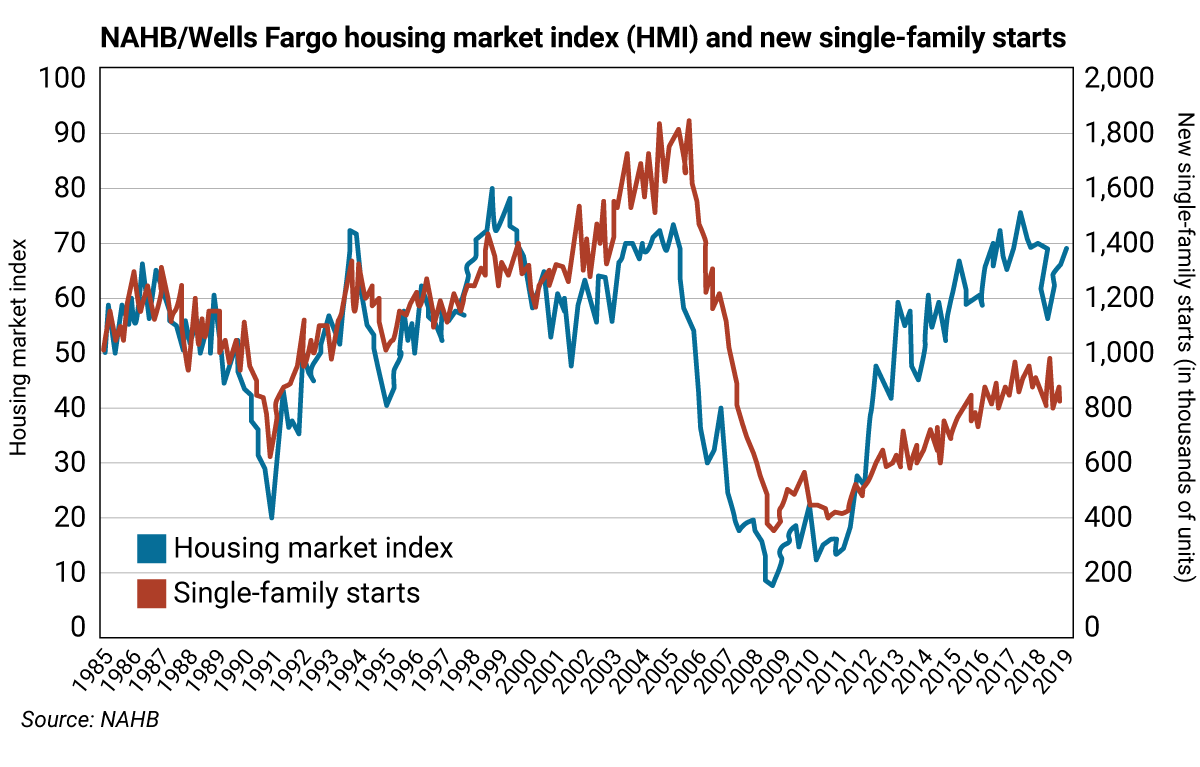
In a robust housing market, starts are higher on the graph than the index. When the inverse is true, as you see above, single-family starts are lagging potential, which is a drag on the U.S. economy.
As we’ve discussed in previous letters, companies concentrating on building smaller homes for first-time buyers have been outperforming. KB Home has the largest year-to-date gain because of this focus, but it has tested a risky level. PulteGroup also tested a risky level. Toll Brothers gained strength recently after acquiring Sabal Homes. The acquisition gives Toll a footprint in South Carolina, where smaller homes are seeing demand in Charleston, Greenville, and Myrtle Beach. Toll also tested a risky level.
What’s interesting is that four of the five homebuilders set their 2019 highs between September 13–18 in anticipation of the positive data reported this week. These four remain 21.5–63.4% below their May 2005 highs.
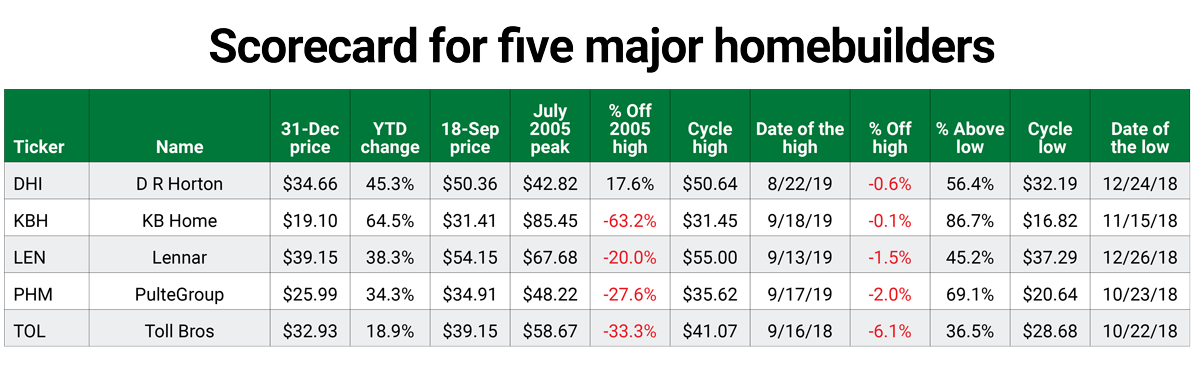
I like homebuilders when their P/E ratios are below 9.0, and only Toll Brothers, with a P/E of 8.23, qualifies on this basis.
Trading strategy
Reduce holdings on D.R. Horton (DHI), KB Home (KBH), Lennar (LEN), PulteGroup (PHM), and Toll Brothers (TOL) on strength to their risky levels provided below.
For details on using trading levels, see the box below.
D.R. Horton (DHI)
- Value (annual): $45.79
- Pivot (semiannual): $47.84
- Pivot (quarterly): $49.95
- Risky (monthly): $52.85
KB Home (KBH)
- Risky (annual): $21.10
- Pivot (semiannual): $27.19
- Pivot (quarterly): $27.23
- Risky (monthly): $31.48
Lennar (LEN)
- Risky (annual): $64.23
- Value (semiannual): $47.57
- Value (quarterly): $49.46
- Risky (monthly): $59.56
PulteGroup (PHM)
- Pivot (annual): $34.20
- Value (semiannual): $31.28
- Pivot (quarterly): $33.42
- Risky (monthly): $35.33
Toll Brothers (TOL)
- Risky (annual): $48.16
- Value (semiannual): $33.34
- Pivot (quarterly): $37.18
- Risky (monthly): $39.64
How to use trading levels
Value, pivot, and risky levels on a chart pinpoint strategic buy and sell levels. They’re a great tool for maximizing gains and limiting losses on stocks you plan to hold long-term.
Risky level: sits above where the stock is trading
Pivot level: often sits right around where the stock is trading. A pivot level is a value level or risky level that was violated within its time horizon. Pivots act as magnets and have a high probability of being tested again before the time horizon expires.
Value level: sits below where the stock is trading
The general idea is to buy around a value level line and reduce holdings around the risky level line. You can rebuild your position on weakness.

 | Rich Suttmeier Founder & CEO, Global Market Consultants |


