
Daily charts provide a roadmap of how a stock has traded and can be used to predict the risk and reward for the stock in the future. Last week, I showed you a daily chart for Apple (AAPL), and the best price levels at which to add to your position or reduce holdings.
Today, we’re looking at the weekly chart for Amazon (AMZN). Weeklies are good for timing changes in direction for a market or specific stock. We’ll study what the weekly data tells us about Amazon over the past five years, and the levels at which to buy and sell over the next three to five weeks.
Click to enlarge
Methodology
Following the crash of 1987, I developed the technical parameters for the weekly charts I’ll be showing you in these pages. I used rigorous back-testing to come up with a methodology that resulted in the fewest false signals. The combination I came up with included a five-week modified moving average (5-week MMA), a 200-week simple moving average (200-week SMA) and a momentum measure known as the 12-week slow stochastic oscillator (12-week SS).
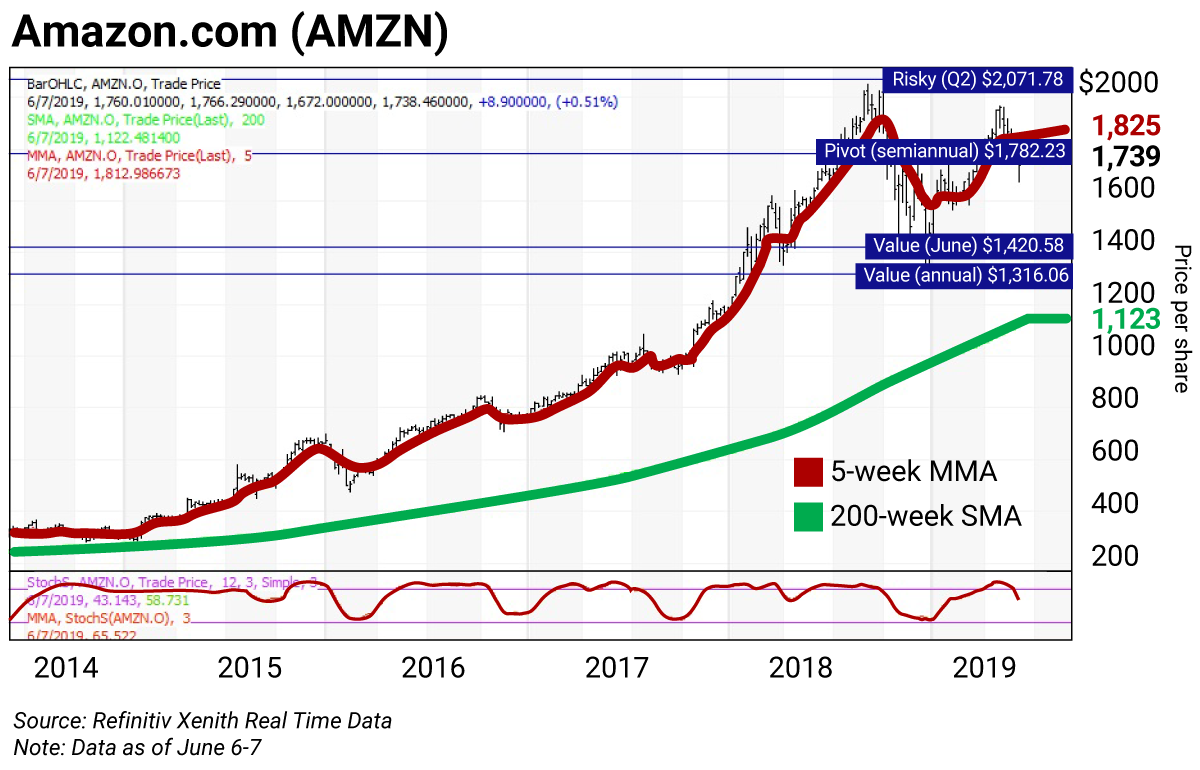
The chart covers five years of weekly high, low, and close levels. The red line following the price bars is the 5-week MMA. The green line is the 200-week SMA, which I also call the technical “reversion to the mean.” The study along the bottom of the chart in red is the weekly slow stochastic reading.
How to use 12-week slow stochastic readings:
The stochastic oscillator is used to generate overbought and oversold trading signals. There’s a fast stochastic reading and a slow stochastic reading (you can read about the differences between these oscillators here). But I found the slow reading works the best.
The stochastic reading scales between 0 and 100. Readings above 80 are considered overbought, and readings below 20 are considered oversold.
I’ve been happy with the results of the 12-week SS measure for more than 30 years. It covers the last 12 weeks of highs, lows, and closes for the stock. There’s a raw calculation of the differences between the highest high and lowest low versus the closes.
Recently I noted that stocks tend to peak and decline 10–20%-plus shortly after a reading rises above 90. I call that an “inflating parabolic bubble,” as a bubble always pops. I also call a reading below 10 “too cheap to ignore.”
Technical breakdown
The weekly chart for Amazon is negative. The stock is below its 5-week MMA at $1,825.65. The stock is well above its 200-week SMA or “reversion to the mean” at $1,122.45. The 12-week SS reading is projected to end this week at 65.37—down from 76.71 on May 31.
At its 2019 high of $1,964.40 set the week of May 3, the stochastic reading was 94.40, which made Amazon in an “inflating parabolic bubble” formation—a signal to reduce holdings.
The horizontal chart lines are the value, pivot, and risky levels. These lines pinpoint buy and sell levels and are a great tool for maximizing gains and limiting losses on stocks you plan to hold long-term.
Value level: sits below where the stock is trading
Pivot level: sits right around where the stock is trading
Risky level: sits above where the stock is trading
The general idea is to buy around a value level line and reduce holdings around the risky level line. You can rebuild your position on weakness.
Amazon’s (AMZN) levels:
Annual value: $1,316.06
June value: $1,420.58
Semiannual pivot: $1,782.23
Second quarter (Q2) risky: $2,071.78
The fundamentals
Amazon has a seven-quarter winning streak in terms of beating analysts’ earnings-per-share estimates. But the online retail powerhouse isn’t for value investors. Its P/E ratio is elevated at 72.59, and it doesn’t offer a dividend.
Action to take
Buy on weakness to the monthly and annual value levels at $1,420.58 and $1,316.06, respectively.
Reduce holdings on strength to the semiannual pivot at $1,782.23 and the quarterly risky level at $2,071.78.
As of today (Friday), Amazon has traded as high as $1,805.78. Investors have the opportunity to reduce holdings above its semiannual pivot. This strength has not altered the fact that the weekly chart for AMZN remains negative.

 | Rich Suttmeier Founder & CEO, Global Market Consultants |
Editor’s note: We received a tremendous amount of positive feedback on Rich’s “Chart of the Day” Apple (AAPL) last week. Thanks to all of you who wrote in. Let us know what you think of today’s chart right here.