Last week, I showed you a weekly chart for Amazon (AMZN)… and why it was a good time for long-term investors to reduce holdings.
Today, we’re looking at the daily chart for Microsoft Corp. (MSFT). MSFT is the largest stock in the universe, with a market capitalization above $1 trillion. The daily chart below shows its strength since trading as low as $93.96 on December 26… and that the stock may have hit its peak for the first half of 2019 at $134.24, set on June 11.
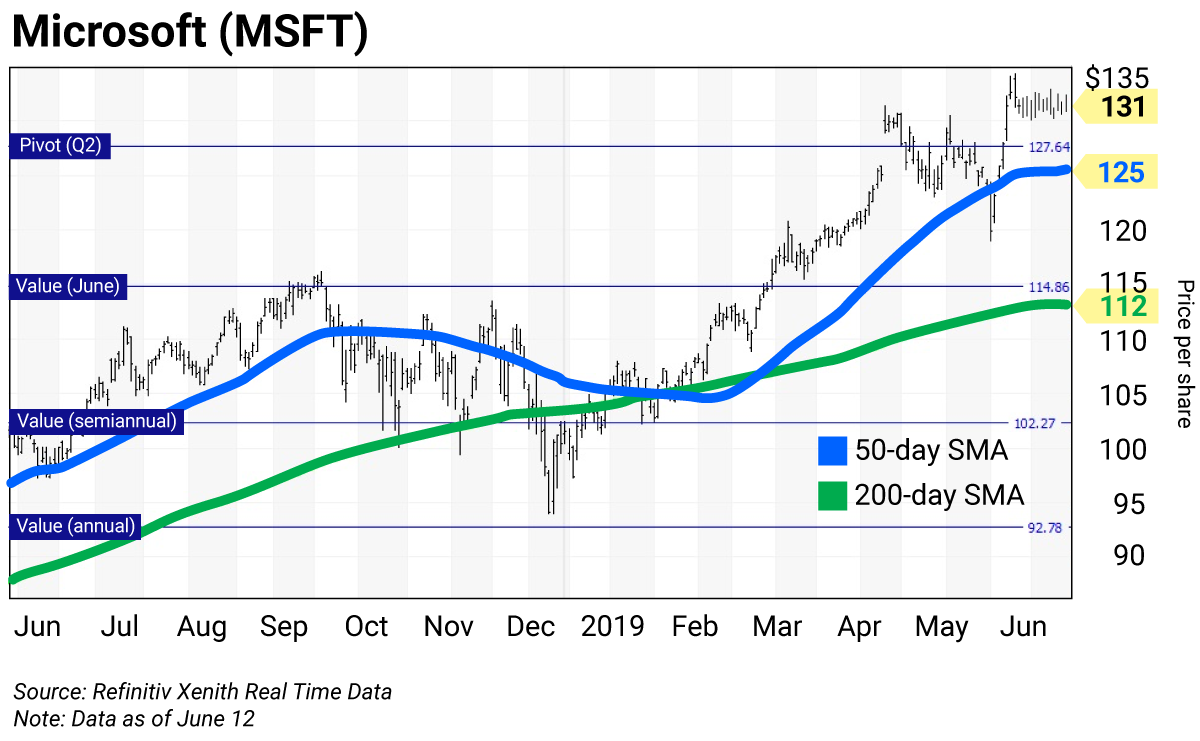
The daily bars (in black) show the high, low, and close for each day of the last 52 weeks, ending in the current price ($131). The blue line is the 50-day simple moving average (50-day SMA). The green line is the 200-day SMA. These averages show levels of support or resistance as the stock trends higher or lower. (You can read more about SMAs here.) MSFT has been above both moving averages since June 5.
Technical Breakdown
When you look at the daily chart for Microsoft, you’ll see a sideways-to-down pattern in Q4 of 2018. December 26 marked a bullish “key reversal,” where the close at $100.56 was above the December 24 high of $97.97. This set the stage for Microsoft’s market cap to grow as the stock moved higher.
Note the value and pivot horizontal lines on the daily chart (I detailed how these work here).
Daily vs. weekly chartsFollowing the crash of 1987, I developed the technical parameters for the charts I’ll be showing you in these pages. I used rigorous back-testing to come up with a methodology that resulted in the fewest false signals. We’ll be using both daily and weekly charts to determine the best price levels at which to add to a position on weakness, or reduce holdings on strength, depending on the term of my analysis. If you’re new to technical trading, daily charts provide a roadmap of how a stock has traded over the last 52 weeks and typically cover a time horizon of a rolling three to five weeks. Weekly charts are typically used for longer-term directional calls. |
Microsoft’s (MSFT) notable levels
Semiannual value: $102.27
Annual value: $92.78
June value: $114.86
Q2 pivot: $127.64
Risky: none
The 2019 rally for Microsoft began with a positive key reversal day on December 26 and ended with a negative “outside trading” day on June 11. An outside trading day means we saw a higher high and a lower low than the prior day. It’s not quite a key reversal—but close enough to call for some profit-taking.
The December 31 close at $101.57 was an important input to my analysis. The semiannual and annual value levels at $102.27 and $92.78, respectively, are still in play. These proved to be a buy zone as 2019 began.
The March 29 close at $117.94 was the input that resulted in the Q2 pivot at $127.64. This level expires at the end of June, and the June 28 close will be the input to determine the Q3 level and monthly level for July. The $114.86 June monthly value level also expires at the end of this month.
On June 11, Microsoft set its all-time intraday high of $134.24. It then traded that day with a low of $131.28, below the June 10 low of $132.
A stock with strong momentum like MSFT may not have a risky level. So we look at other factors…
While I’m not featuring MSFT’s weekly chart today, it shows that the slow stochastic reading will soon fall below the overbought threshold of 80 (on a scale of 0 to 100), which will confirm a longer-term change in direction for the stock.
The fundamentals
Wall Street expects Microsoft’s cloud-based business model to drive quarterly earnings. This includes revenue from Office 365, commercial platform Azure, and Dynamics 365.
Keep in mind that cloud computing is becoming extremely competitive, and the landscape can change quickly. The stock isn’t cheap—its P/E ratio is elevated at 29.29. And the dividend yield of 1.39% is puny.
Action to take
The slow stochastic reading shows that the stock is losing momentum. And we just had a near key reversal. If you’re holding Microsoft (MSFT) long term, reduce holdings by 50%.
Let’s say you invested $10,000 in MSFT shares in 2009 at $25 per share. That gives you 400 shares. With the stock trading at $131 per share, your investment is worth $52,400. If you sell 50%, you’ll bank $26,200, with 200 shares remaining.
You can rebuild your position on weakness to a value level. Based on the closing price on Friday, June 28—the last business day of the month—my proprietary analytic model will show new levels for July, Q3, and the second half of 2019. I’ll include an update with my usual Friday letter.

 | Rich Suttmeier Founder & CEO, Global Market Consultants |
Editor’s note: Rich joined Frank on this week’s Wall Street Unplugged to discuss recent Federal Reserve actions… how to make money in today’s market with technical analysis… and his favorite sectors right now. And if you’re an All-Star Portfolio subscriber, check your member page for Rich’s top stock recommendation today.
If you’re not an All-Star Portfolio member, click here to learn how to access Rich’s top name… and other behind-the-scenes picks from some of the best minds on Wall Street.
More from Rich… |
| – |