It’s time to book profits on Apple.
In my first “Chart of the Week” posted on May 31, I recommended buying Apple at a point of weakness.
Back then, the stock was in the middle of a pullback, with shares down 17% since the start of May. This sharp decline left Apple trading below its annual pivot at $182.85, but slightly above its semiannual value level at $168.72.
In my trading system, this area acts as a “buy zone.”
As I told readers on May 31, “The chart suggests downside risk to its semiannual value level at $168.72, which is the level at which to buy Apple on share price weakness.”
In the five months since then, shares of Apple shifted back into an uptrend. Investors who bought the stock at $176.21 (the May 31 open) could have sold the stock at $249.59 this week, booking a profit of 41.6%.
Unfortunately, this big move has also pushed Apple into overbought territory. As you can see in this week’s chart, the stock is now sitting above its fourth quarter pivot at $235.86. It’s trading right around the weekly risky level, which is a major red flag in my trading system. It means the stock is showing significant downside risk.
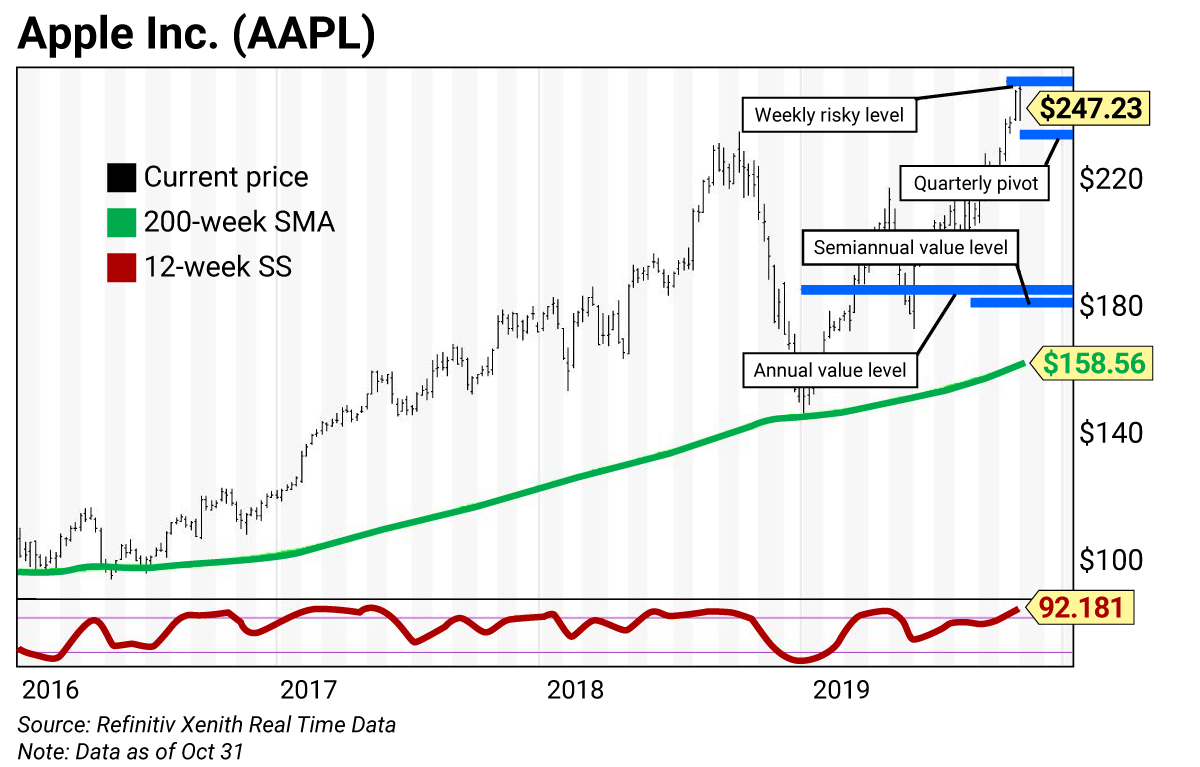
Another warning comes from the 12-week slow stochastic (SS) reading. You can see this indicator included at the bottom of the chart. Whenever this reading is above 90, it’s called an “inflating parabolic bubble.” It acts as a warning for a possible decline of 20% or more over the next three to five weeks… and it’s happened to Apple before.
In October 2018, Apple hit a high of $233.47, and its price-to-earnings (P/E) ratio—an important value metric for fundamental investors—went as high as 18.87. Shares fell 39% over the next few months, hitting a low of $142 during the first week of 2019. That’s the last time Apple’s 12-week SS reading was above 90 until now.
If history repeats itself, Apple investors could see another big selloff in the coming weeks.
In short, when the SS reading goes above 90, it’s time to sell the stock.
Investors who rely on fundamentals should consider watching this reading, as well. Readings above 90 tend to happen when a stock’s valuation becomes stretched. In contrast, when the SS reading falls below 10, there’s a good chance the stock is cheap on a fundamental basis.
You can see this idea playing out in this week’s chart…
It shows the technical “reversion to the mean,” or 200-week simple moving average (in green), at $158.56. Along this moving average are three major buying opportunities over the past few years. They happened in June 2013, June 2016, and during the first week of 2019. In each of these cases, the SS reading broke below 10. At the same time, Apple’s P/E ratio fell to bargain levels.
Put simply, whenever shares of Apple get cheap enough, value investors swoop in to drive the stock higher over the next few months.
Unfortunately, that’s not what is happening now.
Apple reported solid quarterly earnings after the closing bell Wednesday, October 30. The results were good, but not enough to trigger a breakout to the upside. The stock is currently sitting just below its weekly risky level, which is where investors should consider taking profits.
Apple trading levels
- Risky (weekly): $249.59
- Pivot (quarterly): $232.79
- Value (annual): $182.72
- Value (semiannual): $178.68
Trading strategy
Sell Apple (AAPL) based on an overbought technical setup and expensive valuation. You can add to your position on weakness around its value levels. (Wednesday’s quarterly earnings report has created extra volatility in the stock, but that doesn’t affect our trading levels.)
How to use trading levels
The trading levels on my charts pinpoint strategic buy and sell levels. They’re a great tool for maximizing gains and limiting losses on stocks you plan to hold long-term.
Value levels and risky levels are based upon the last nine monthly, quarterly, semiannual and annual closes. The first set of levels was based upon the market closes on December 31. The original annual level remains in play.
Value level: Sits below where the stock is trading.
Pivot level: Often sits right around where the stock is trading. A pivot level is a value level or risky level that was violated within its time horizon. Pivots act as magnets and have a high probability of being tested again before the time horizon expires.
Risky level: Sits above where the stock is trading.
To capture share price volatility, investors should buy on weakness to a value level and reduce holdings on strength to a risky level.

 | Rich Suttmeier Founder & CEO, Global Market Consultants |