On September 9, 2019 I made the following market call on Forbes.com…
“The Dow, S&P, and Nasdaq are poised for new highs, then bust” (see below).
Based on current technical conditions, the bust is already starting. That’s bad news for Apple, since it’s one of the biggest components of major indexes like the S&P 500. Some folks would argue that Apple is the most important stock on the planet.
If the stock market declines… so will Apple. It’s unavoidable!
The major index averages came within 1% of hitting new all-time highs in September. It was a close call, but this lack of new highs means we’re more likely to see a pullback soon.
Apple isn’t immune to the potential downside pressure. The stock is heavily weighted in many exchange-traded funds (ETFs). When investors sell an ETF that owns Apple, the manager of the ETF must sell shares of Apple.
Looking at Apple’s daily chart, I see another huge red flag for investors… a potential “double top,” or two consecutive highs that indicate a strong price ceiling and an impending reversal.
The first top happened when Apple set its all-time intraday high of $233.47 on October 3, 2018. A few days ago, on October 1, the stock set its high for 2019—a few points below at $228.22.
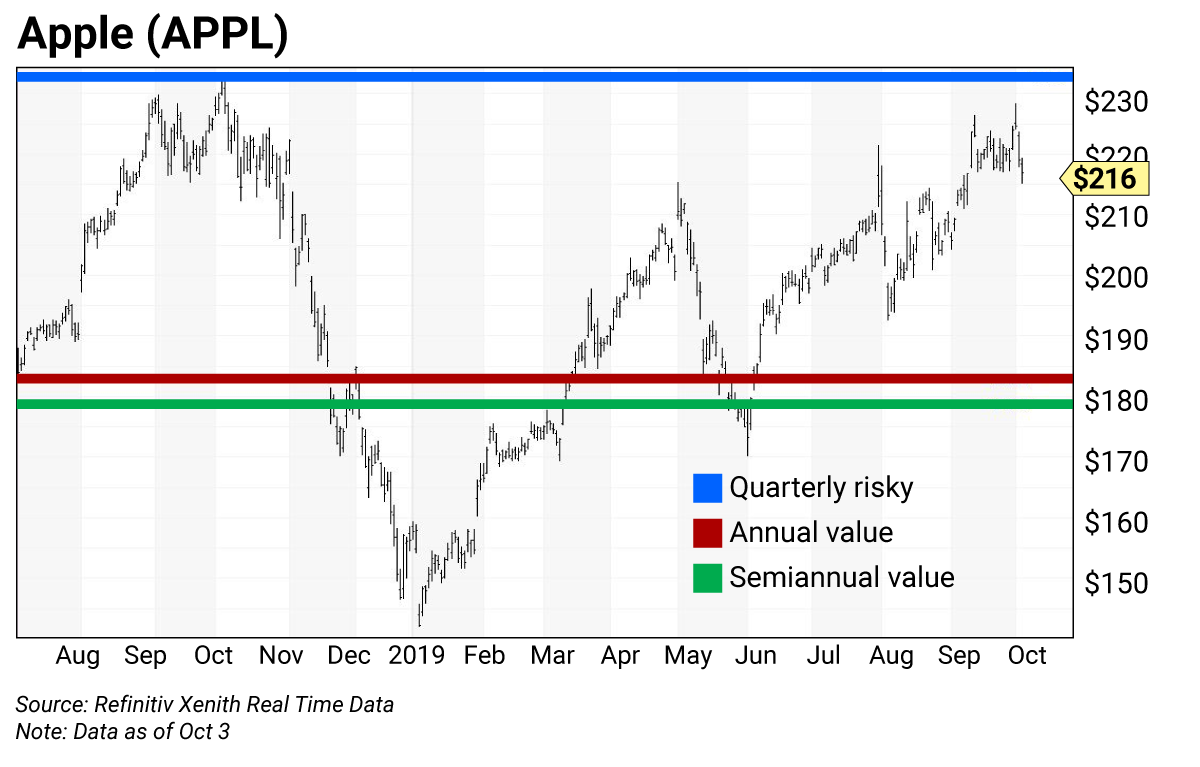
My proprietary analytics show a quarterly risky level at $232.87—below the all-time high—which means a higher high is unlikely anytime soon. And when a double top is a year apart like Apple’s, as opposed to, say, a month apart, it means resistance to a higher high is very strong.
This negative technical setup is happening while most Wall Street analysts are still super bullish on Apple. According to Bloomberg data, Apple has 24 “buy” ratings, 19 “hold” ratings, and only five “sell” ratings.
JPMorgan raised its price target on Apple just a few days ago. On September 30, the bank’s analysts published a report saying that shares of Apple will surge by 20% on strong iPhone demand. They raised their price target from $243 to $265, while reiterating their “overweight” rating.
I think this is a terrible call. If you follow JPMorgan’s research, understand that the analysts do not look at the technical charts.
JPMorgan’s bullish call was doomed from the start. The day after it published its latest Apple report, the whole market plunged on negative economic news. The ISM Manufacturing Index, which is used to gauge the strength of U.S. manufacturing activity, showed a reading of 47.8 for September, which was well below economists’ expectations. (A reading above 50 indicates expansion.)
Shares of Apple led an instant market reversal to the downside. This makes sense, since Apple is one of the largest manufacturers in the world. The negative ISM number is a warning that a recession could be around the corner.
Looking ahead, if Apple’s stock ends the week below $217.14, it would confirm a weekly “key reversal,” which would make the technical outlook even worse.
The daily chart above shows Apple’s fourth quarter (Q4) risky level at $232.87 as the highest horizontal line. As I mentioned, it’s below the all-time intraday high of $233.47 set a year ago.
For the remainder of 2019, Apple’s annual and semiannual value levels are $182.87 and $178.71, respectively. That means the downside risk is significant—at least 20%.
Looking year to date, the annual level was a pivot (or magnet) first tested on March 13, then tested five times between May 13–June 6 as a buying opportunity.
The levels I provide in these pages have proven to show optimal times to buy on weakness (value) and sell on strength (risky). For more on trading levels, see the box below.
Here’s a snapshot of Apple’s current levels:
- Pivot (monthly): $235.00 (not shown)
- Risky (quarterly): $232.87
- Value (annual): $182.87
- Value (semiannual): $178.71
Trading strategy
Shares of Apple should remain a core long position in your portfolio. But given its limited upside, it’s time to reduce holdings…
Sell Apple on strength up to its Q4 risky level at $232.87, which is below the all-time intraday high of $233.47 set on October 2018.
How to use trading levels
The trading levels on my charts pinpoint strategic buy and sell levels. They’re a great tool for maximizing gains and limiting losses on stocks you plan to hold long-term.
Value levels and risky levels are based upon the last nine monthly, quarterly, semiannual and annual closes. The first set of levels was based upon the market closes on December 31. The original annual level remains in play.
Value level: sits below where the stock is trading
Pivot level: often sits right around where the stock is trading. A pivot level is a value level or risky level that was violated within its time horizon. Pivots act as magnets and have a high probability of being tested again before the time horizon expires.
Risky level: sits above where the stock is trading
To capture share price volatility, investors should buy on weakness to a value level and reduce holdings on strength to a risky level.

 | Rich Suttmeier Founder & CEO, Global Market Consultants |
Editor’s note: The Forbes article Rich mentioned above garnered 41,000 page views. If you missed it, it’s well worth a read: The Dow, S&P, and Nasdaq are poised for new highs, then bust.