AT&T’s story stretches back to 1877, when Alexander Graham Bell founded the Bell Telephone Company.
A few years later, he launched the American Telephone and Telegraph Company, or AT&T. The combined entity became America’s primary telephone carrier.
My grandfather on my mother’s side was an electrical engineer who spent his entire career working for Bell Labs in Brooklyn, New York. Bell Labs was AT&T’s R&D segment and a technology leader.
My grandfather worked on one of the world’s first, if not the first, radio transmissions at Bell Labs. He told me that when the signal test was successful, he took out his cornet and played “The Star-Spangled Banner.”
Today, the AT&T wireless network is one of the most reliable in North America, connecting people and businesses with its technology. It offers high-speed internet, as well as web conferencing and network security services. And now, AT&T is rebranding DirecTV into the AT&T TV Family (more on this below).
Based on the recent action in AT&T’s chart, now is a great time to buy the stock.

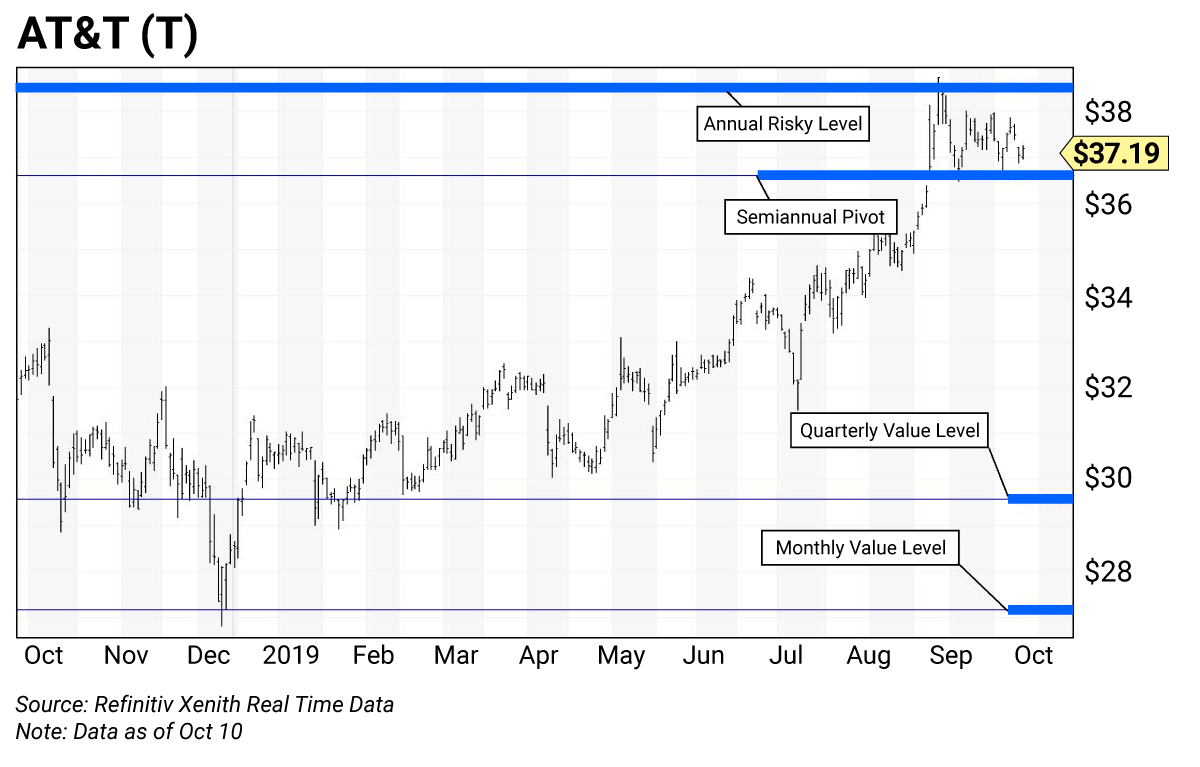
On September 9, shares broke out above their semiannual pivot at $36.60. After pulling back from the annual risky level at $38.54, the stock went into a consolidation phase over the last month.
By holding above the $36.60 semiannual pivot level, the stock confirmed it had entered trading range. It’s been trading in this range for the past three weeks.
The longer a stock stays in a trading range after an upside breakout, the better the odds become for a continued upward move. We can buy shares of AT&T now, while they’re range-bound, in anticipation of higher prices over the next few months.
The upside target for AT&T’s stock is its July 2016 high of $43.89. That’s about 17% above its recent price.
But there’s another huge potential catalyst for AT&T…
Earlier this week, Charles Gasparino of Fox Business announced that AT&T was in talks with private equity firm Apollo Global Management. The firm would provide the financing for a proposed merger between AT&T’s DirecTV and the Dish Network Corporation. Under the proposed agreement, AT&T would still control DirecTV, while Apollo and Dish would receive minority equity stakes.
The potential deal is set up to relieve AT&T of about half the debt it took on when it bought DirecTV in 2015. A reduced debt load would be a positive catalyst that could drive shares of AT&T higher in the long term.
The new AT&T is nothing like your father’s or grandfather’s AT&T. Over the past few years, it has expanded far beyond its traditional landline telephone business. The company runs a huge wireless network and is now branching out into multimedia products. AT&T is a growth story with a dividend.
Given its 5.42% dividend yield, this stock deserves to be a long-term portfolio holding. Any weakness that brings the stock to lower value levels is an opportunity to add to your position.
AT&T’s trading levels
- Risky (annual) $38.53
- Pivot (semiannual) $36.60
- Value (quarterly) $29.56
- Value (monthly) $27.16
Buy AT&T for its generous dividend. Buy AT&T for the growth in its improved products and services. Buy AT&T for its focus on “Mobility & Entertainment.”
Trading strategy
AT&T is trading between its semiannual pivot at $36.60 and its annual risky level at $38.53. Buy now, and if there’s
How to use trading levels
The trading levels on my charts pinpoint strategic buy and sell levels. They’re a great tool for maximizing gains and limiting losses on stocks you plan to hold long-term.
Value levels and risky levels are based upon the last nine monthly, quarterly, semiannual and annual closes. The first set of levels was based upon the market closes on December 31. The original annual level remains in play.
Value level: Sits below where the stock is trading.
Pivot level: Often sits right around where the stock is trading. A pivot level is a value level or risky level that was violated within its time horizon. Pivots act as magnets and have a high probability of being tested again before the time horizon expires.
Risky level: Sits above where the stock is trading.
To capture share price volatility, investors should buy on weakness to a value level and reduce holdings on strength to a risky level.

 | Rich Suttmeier Founder & CEO, Global Market Consultants |


